
Key facts
Why is it important?
Many of the principal causes of ill-health among Aboriginal and Torres Strait Islander peoples are nutrition-related diseases, such as heart disease, type 2 diabetes and renal disease. Diet-related diseases are caused by combinations and interactions of environmental, behavioural, biological, social and hereditary factors. Of particular relevance in Indigenous communities are factors such as socioeconomic status and other diet-related risk factors for disease including insulin resistance, glucose intolerance, obesity (especially central fat deposition), hypertension, high blood triglycerides, perinatal and postnatal nutrition and childhood nutrition (Longstreet et al. 2008; NHMRC 2013).
A healthy and balanced diet can play a role in preventing and delaying heart disease, type 2 diabetes and other chronic diseases. For Indigenous Australians, the higher rate of illness and disease they experience compared with non-Indigenous Australians is directly related to a lack of access to affordable and healthy food (that is, food insecurity). Food insecurity can lead to obesity and malnutrition. Key factors affecting Indigenous Australians’ access to adequate food include poor access (due to, for example remoteness and low income) and poor food availability (for example high costs of food and limited availability of nutritious foods) (Davy 2016).
The Burden of Disease study attributed 9.7% of the total burden of disease for Indigenous Australians to 13 dietary risk factors (joint effect) in 2011 (AIHW 2016). A large proportion of the burden due to poor diet is a result of excess intake of energy-dense foods which are high in energy, saturated fat, refined sugars and salt, and/or inadequate intake of nutrient-dense foods, including fruit, vegetables and wholegrain cereals (NHMRC 2013). There is a substantial quantity of evidence that associates dietary excesses and imbalances with chronic disease.
The National Health and Medical Research Council specify recommendations for intake of food from the five food groups for good health, quality of life, weight maintenance and the prevention of diet-related chronic diseases. They include recommendations for an adequate minimum daily intake of fruit and vegetables. Recommended food consumption depends on age, sex and life stage (for example pregnancy and breastfeeding) (ABS 2014; NHMRC 2013). While a diet high in saturated fats and refined carbohydrates increases the likelihood of developing disease, regular exercise and intake of fibre-rich foods, such as fruit and vegetables, can have a protective effect against disease (Wang et al. 2014).
Good maternal nutrition and healthy infant and childhood growth are fundamental to the achievement and maintenance of health throughout the life cycle. Inadequate nutrition during pregnancy is associated with low birthweight in babies (see measure 1.01 Low birthweight).
Data findings
The latest national data on dietary behaviours for Indigenous Australians comes from the 2018–19 National Aboriginal and Torres Strait Islander Health Survey (Health Survey).
Daily fruit and vegetable intake
The 2018–19 Health Survey results showed that 64% of Indigenous children aged 4–14 ate the recommended daily amount of fruit and 3.2% ate the recommended daily amount of vegetables. The proportion of Indigenous children aged 4–14 who ate the recommended daily intake of both fruit and vegetables was 3%.
For Indigenous Australians aged 15 and over, 39% ate the recommended daily amount of fruit, 4.2% ate the recommended daily amount of vegetables, and 2.6% ate the recommended daily intake of both fruit and vegetables.
Indigenous children aged 2–4 had the highest proportion of adequate daily fruit intake (85%) and vegetable intake (17%) (Table D2.19.11, Figure 2.19.1).
Figure 2.19.1: Whether met guidelines for adequate intake of fruit and vegetables, Indigenous Australians, by age, 2018–19
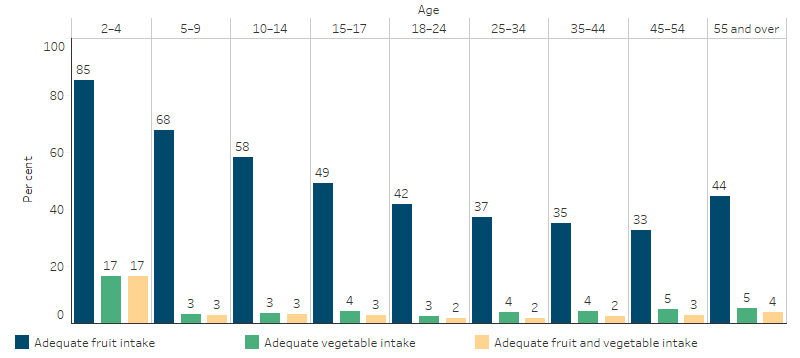
Notes:
1. Based on 1 serve of fruit for children aged 2–8 years and 2 serves for persons aged 9 years and over.
2. Based on 2 serves of vegetables for children aged 2–3 years, 4 serves for ages 4–8 years and 5 for persons aged 9 years and over with the exception of 18–49 year old males to eat 6 serves.
Source: Table D2.19.11. AIHW and ABS analysis of National Aboriginal and Torres Strait Islander Health Survey 2018–19.
Between 2014–15 and 2018–19 in Non-remote areas, there was a decrease in the proportion of Indigenous Australians aged 12 and over who met the recommended daily vegetable intake, from 6.1% to 4.2% (20,020) and the recommended daily fruit intake (from 46% to 40%; 192,260) (Table D2.19.10).
The adequate daily intake of fruit and vegetables was similar for Indigenous Australians aged 12 years and over in Remote and Non-remote areas (2.7% and 2.1%, respectively) (Table D2.19.11).
A higher proportion of Indigenous females aged 12 and over reported an adequate daily fruit (45%) and vegetable intake (6.2%) compared with Indigenous males (37% and 2%, respectively) (Table D2.19.11).
Indigenous Australians aged 4–14 were more likely to consume 1 or more serves of fruit per day (91%) compared with those aged 15 and over (70%). Vegetable consumption of at least 1 serve per day was similar for Indigenous children aged 4–14 (83%) and for those aged 15 and over (85%) (Table D2.19.11, Figure 2.19.2).
Figure 2.19.2: Usual daily serves of fruit and vegetables, Indigenous Australians, by food group, age group and number of serves, 2018–19
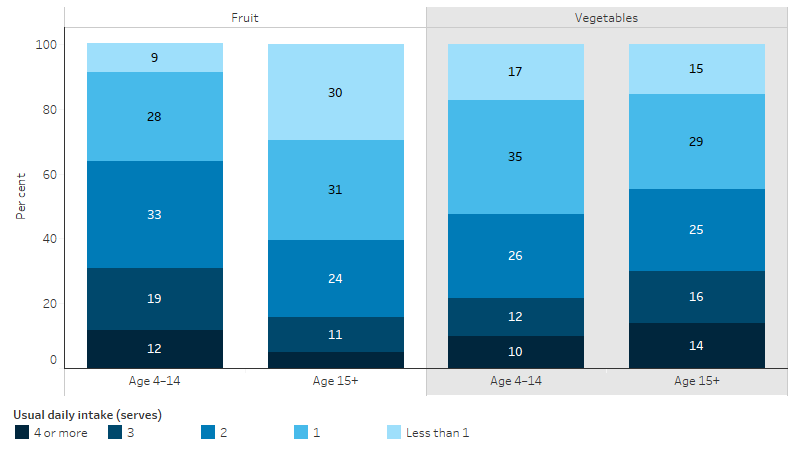
Source: Table D2.19.11. AIHW and ABS analysis of National Aboriginal and Torres Strait Islander Health Survey 2018–19.
After adjusting for differences in the age structure of the two populations, Indigenous Australians aged 12 and over were 78% as likely to eat the recommended levels of daily fruit intake than non-Indigenous Australians (40% and 52%, respectively). Indigenous Australians aged 12 and over were 62% as likely to meet the guidelines for daily vegetable intake (0.6 times) than non-Indigenous Australians (4.3% and 7%, respectively).
Indigenous Australians aged 12 and over were 1.7 times as likely as non-Indigenous Australians to report eating less than 1 serve of fruit daily (30% and 17%, respectively) and 2.4 times as likely to report eating less than 1 serve of vegetables daily (15% and 6.2%, respectively) (Table D2.19.5, Figure 2.19.3).
Figure 2.19.3: Usual daily serves of fruit and vegetables, by Indigenous status, persons aged 12 years and over, 2018–19
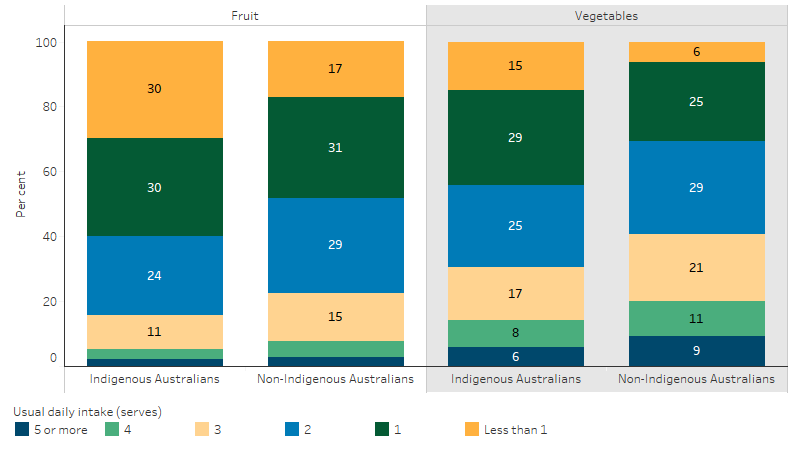
Source: Table D2.19.5. AIHW and ABS analysis of National Aboriginal and Torres Strait Islander Health Survey 2018–19 and National Health Survey 2017–18.
Discretionary foods
Discretionary foods are those considered to be of little nutritional value. They tend to be higher in saturated fats, sugars, salt and/or alcohol and therefore are associated with an increased risk of obesity and/or chronic diseases. The Australian Dietary Guidelines specifies limits on discretionary foods, which may include cakes, biscuits, confectionery, chocolate, pastries, ice confections, butter, cream, potato chips, crisps and other fatty or salty snack foods, sugar-sweetened soft drinks and cordials, sports and energy drinks and alcoholic drinks (ABS 2015).
The nutrition component of the 2012–13 Aboriginal and Torres Strait Islander Health Survey found that 41% of reported total daily energy consumed by Indigenous Australians aged 2 and over was from discretionary foods, compared with 35% for non-Indigenous Australians. Similar proportions of Indigenous males and females aged 2 and over consumed discretionary foods (ABS 2015).
More than twice as many Indigenous males (26%) as Indigenous females aged 19 and over (12%) reported consuming alcoholic beverages. Median alcohol consumption was over twice as high for Indigenous consumers than non-Indigenous consumers (1,134 grams compared with 475 grams) (ABS 2015).
In 2012–13, Indigenous Australians aged 2 and over consumed an average of 75 grams of free sugars per day (equivalent to 18 teaspoons of white sugar). Added sugars made up the majority of free sugar intake with an average of 68 grams (or 16 teaspoons) consumed, and the additional 7 grams of free sugars came from honey and fruit juice.
Indigenous Australians derived an average of 14% of their daily energy from free sugars, exceeding the World Health Organisation recommendation that both children and adults should limit their intake of free sugars to less than 10% of dietary energy.
Free sugar intake was highest for Indigenous Australians living in Non-remote areas, where the average daily consumption was 78 grams (18.5 teaspoons). This was around 3 teaspoons (12 grams) higher than people living in Remote areas (65 grams or 15.5 teaspoons).
Indigenous Australians consumed 15 grams (almost 4 teaspoons) more free sugars on average than non-Indigenous Australians. Beverages were the most common source of free sugars for both populations; however, Indigenous Australians derived a higher proportion of free sugars from beverages than non-Indigenous Australians (67% compared with 51%) (ABS 2016).
In 2012–13, Indigenous children aged 2–3 were 3.1 times as likely as non‑Indigenous children to have consumed soft drinks and flavoured mineral waters (18% compared with 6%, respectively). Indigenous Australians in Non-remote areas were more likely than those in Remote areas to consume: fruit (49% compared with 35%) and soft drinks (39% compared with 32%); and were less likely to consume meat dishes (74% in Non-remote compared with 81% in Remote areas).
In 2012–13, Indigenous Australians aged 2 and over were more likely than non-Indigenous Australians to consume: meat (76% compared with 69%), snack foods (20% compared with 15%) and soft drinks (37% compared with 29%), and were less likely to consume vegetables (65% compared with 75%) (ABS 2015) (Figure 2.19.4).
Figure 2.19.4: Major food group consumption, by Indigenous status, persons aged 2 and over, 2012–13
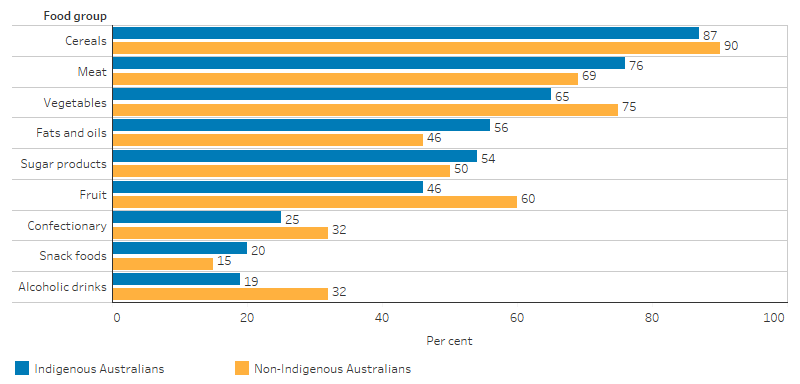
Note: Alcohol data is for persons aged 19 and over.
Source: Australian Aboriginal and Torres Strait Islander Health Survey: Nutrition Results—Food and Nutrients 2012–13 (ABS Table 4.1).
Dietary behaviour and other health and socioeconomic characteristics
The 2018–19 Health Survey showed an association between dietary behaviour and other health and socioeconomic characteristics. For Indigenous Australians aged 15 and over:
- Those who were employed were more likely than those unemployed to report an adequate daily vegetable intake (4.9% compared with 1.8%, respectively).
- Home owners were more likely than renters to report an adequate daily vegetable intake (5.8% compared with 3.4%, respectively).
- Those with low/moderate psychological distress were more likely to report eating an adequate fruit intake than those with high/very high distress (33% compared with 41%, respectively) (Table D2.19.12, Table D2.19.13).
According to the 2012–13 National Aboriginal and Torres Strait Islander Nutrition and Physical Activity Survey, 22% of respondents had run out of food in the last 12 months and could not afford to buy more (7% of respondents had run out and gone without food, while 15% had run out but not gone without food). The proportion of non-Indigenous Australians who had run out of food and could not afford to buy any more in the last 12 months was 4%.
Indigenous Australians in Remote areas were more likely to run out of food than people in Non-remote areas (31% and 20% respectively) and slightly more likely to go without food if they ran out (9% and 6% respectively) (ABS 2015).
Research and evaluation findings
Evidence shows that prior to the European colonisation of Australia, the diet of Indigenous Australians was varied and rich in nutrient-dense foods that helped to protect against preventable chronic disease (Brimblecombe et al. 2014). The introduction of refined cereals, added sugars, salts and saturated fats has led to a diet that is recognised as a major risk factor for chronic diseases, including type 2 diabetes and kidney failure (Brimblecombe & O’Dea 2009). Socioeconomic factors including lower incomes, lower employment, lower educational opportunities, inadequate housing and poorer access to a healthy and affordable food supply have all contributed to the poorer nutrition status of Indigenous Australians, compared with non-Indigenous Australians (Lee & Ride 2018).
Findings from a study exploring the social context of food choice and the factors that shape food choice amongst Aboriginal adults living in remote Australian communities found that knowledge, health and resources supporting decisions relating to food choice were considered out-of-balance. While participants in the study revealed intricate knowledge of their traditional food system, they felt unable to replicate the diet due to a range of barriers, including a lack of food choice and lack of affordability (Brimblecombe et al. 2014).
Evidence suggests that people living in poverty tend to maximise calories per dollar spent on food. Energy-dense foods rich in fats, refined starches and sugars represent the lowest-cost options, while healthy diets based on lean meats, whole grains and fresh vegetables and fruits are more costly (Drewnowski & Specter 2004). People in vulnerable groups may therefore simultaneously be overweight or obese and experience food insecurity (AIHW 2012). Research on the role of energy cost in food choices for an Aboriginal population in Northern Australia found a marked energy cost differential between energy-dense, nutrient-poor foods, rich in refined carbohydrates and fats, and high-quality, nutrient-dense foods. Low-quality food with high energy density was associated with lower costs, influencing the capacity of Indigenous Australians in remote communities to attain a healthy diet (Brimblecombe & O’Dea 2009).
Geographical and environmental factors can influence a person’s access to a healthy diet. Food security is influenced by availability, accessibility and affordability, all of which are of particular importance in rural and remote areas. Remote stores often have a limited range of foods, particularly perishable foods such as fresh fruit, vegetables and dairy foods, and purchase prices are usually higher (Dietitians Association of Australia 2013; Pratt et al. 2014; Scelza 2012). Low income combined with high food costs results in many Indigenous Australians spending a large proportion of their income on food and contributes to concerns about going without food (Brimblecombe & O’Dea 2009).
Almost half of the carers of children included in the Longitudinal Study of Indigenous Children reported barriers to their children’s nutrition. A dislike of fruit and vegetables was the most common barrier, reported by 33% of carers. Problems accessing fruit and vegetables were common among carers living in Remote and Outer regional settings and among disadvantaged carers living in Urban and Inner regional settings; the cost, availability and quality of fruit and vegetables were also substantial barriers to access (Thurber et al. 2017).
Go4Fun is a free program that operates in New South Wales for children aged 7–13 who are above a healthy weight. The government-funded program operates for 10 weeks during the school term and is run by qualified health professionals, including dietitians and physiologists. Between 2009 and 2012, almost 6% of the program’s participants were Indigenous. An evaluation of the program showed that Indigenous children were less likely to complete the program and highlighted the need for stronger engagement with the Indigenous community to develop more culturally appropriate strategies (Welsby et al. 2014).
The School Nutrition Projects (SNP) were introduced in the Northern Territory as part of the Australian Government’s 2007 Northern Territory Emergency Response (NTER). In 2016, an evaluation of aspects of the SNP investigated the dietary requirements of students in remote Indigenous schools, enablers and barriers to program delivery, and student’s nutrition during school holiday periods. The SNP was found to provide an important part of the daily diet of students, and most of the food and beverages provided were healthy, with fruit and vegetables dominating. However, some food and beverages were considered discretionary, and it was suggested that minimising inclusion of these would help achieve total saturated fat and sodium intake closer to the World Health Organization recommendations (Menzies School of Health Research 2017).
The Deadly Choices program is a school-based chronic disease and education program that encourages young people to be positive role models in reshaping health, lifestyle and physical activity choices. An evaluation of the program found promising results in physical activity, breakfast intake, and fruit and vegetable consumption, all of which are core components of healthy weight management (Malseed et al. 2014).
An evaluation of the community-led healthy lifestyle program ‘Knockout Health Challenge’ in New South Wales found the program was effective in reducing weight and in the promotion of healthy lifestyles among Aboriginal people. At the end of the challenge, participants were more physically active and had increased fruit and vegetable consumption. Participants identified other positive health effects such as improved wellbeing, reduced anxiety and stress, increased community awareness of healthy lifestyles, and increased community pride and connectedness. Men were less likely to participate than women and were less likely to reduce their Body Mass Index during the challenge, suggesting that further research is needed regarding how to engage men in healthy lifestyle interventions (Passmore et al. 2017).
The National Aboriginal and Torres Strait Islander Nutrition Strategy and Action Plan 2000–2010 (NATSINSAP) was a framework to drive dietary changes and improve the nutritional status of Indigenous Australians. In 2009–10, NATSINSAP was evaluated to determine how effectively it was implemented and how it could be more effective and responsive to the current environment. The evaluation identified that the key achievements were in three of the seven priority action areas: food supply in remote and rural communities, disseminating and communicating good practice, and an Aboriginal and Torres Strait Islander nutrition workforce. Some specific examples within these priority action areas include: the launch of the remote Indigenous stores and takeaways resources, the development of nationally accredited nutrition training materials for Indigenous health workers, the revival of the National Nutrition Networks conference, and the development of an Indigenous nutrition web directory on the Australian Indigenous Health InfoNet. However, there was little improvement in household food security or nutrition issues in urban areas (Lee & Ride 2018).
Implications
Poor nutrition, resulting from inadequate dietary behaviours, is a major contributor to the ill-health experienced by Indigenous Australians. The combined effect of dietary risk factors is the second highest contributor to the burden of disease experienced by Indigenous Australians, behind tobacco use (AIHW 2016). Given the health risks associated with poor nutrition, addressing dietary behaviours is necessary to improve the overall health of Indigenous Australians.
The findings of this measure suggest that targeted effort is needed in engaging Indigenous Australians in improving their diets. Geographic factors may also require tailored approaches. Different dietary behaviour patterns by remoteness may reflect a combination of socioeconomic and food security and availability factors. While Indigenous Australians in Remote areas were more likely to run out of food and could not afford to buy more, those in Non-remote areas had a higher consumption of free sugars.
The primary prevention of disease through nationally coordinated, cross-sectoral policy action is likely to be the most cost-effective way to address poor nutrition (Lee & Ride 2018). Programs targeting nutrition are often incorporated into obesity strategies; however, a healthy diet is also determined by availability and affordability of healthy foods, so addressing these aspects should also be considered in the development of any strategy (Lee & Ride 2018). However, this does not mean a ‘one-size fits all’ approach is required. Success in improving access to affordable and nutritious food will require Indigenous participation in determining solutions to food security (Davy 2016).
Programs and interventions will require adequate resourcing, and those likely to achieve the greatest success will be those that are developed with Indigenous Australians and that are culturally appropriate (Lee & Ride 2018). The Looma Healthy Lifestyle Project in remote Western Australia, is one example of a successful program that, through education, physical activity sessions, and policies to improve food supply, has resulted in sustainable change in dietary intake, as well as improvements in blood glucose levels. Community members initiated and designed the project and local people were employed across all areas of the program (Browne et al. 2018; Rowley et al. 2000).
A recent review of evaluation methods and quality in Australian health promotion agencies highlighted the importance of improving the quality of evaluations in health promotion and preventive health to help build the evidence base for prevention strategies (Schwarzman et al. 2019).
References
- ABS (Australian Bureau of Statistics) 2014. Australian Aboriginal and Torres Strait Islander Health Survey: Updated Results 2012–13. Canberra: ABS.
- ABS 2015. Australian Aboriginal and Torres Strait Islander Health Survey: Nutrition Results–Food and Nutrients 2012-13. Cat. no. 4727.0.55.005. Canberra: ABS.
- ABS 2016. Australian Aboriginal and Torres Strait Islander Health Survey: Consumption of Added Sugars, 2012-13. Cat. no. 4727.0.55.009. Canberra: ABS.
- AIHW (Australian Institute of Health and Welfare) 2012. Australia's food and nutrition 2012. Canberra: AIHW.
- AIHW 2016. Australian Burden of Disease Study 2011: impact and causes of illness and death in Aboriginal and Torres Strait Islander people 2011. Canberra: AIHW.
- Brimblecombe J, Maypilama E, Colles S, Scarlett M, Dhurrkay J, Ritchie J et al. 2014. Factors influencing food choice in an Australian Aboriginal community. Qualitative health research 24:387-400.
- Brimblecombe J & O’Dea K 2009. The role of energy cost in food choices for an Aboriginal population in northern Australia. The Medical Journal of Australia 190:549-51.
- Browne J, Adams K, Atkinson P, Gleeson D & Hayes R 2018. Food and nutrition programs for Aboriginal and Torres Strait Islander Australians: an overview of systematic reviews. Australian Health Review 42:689-97.
- Davy D 2016. Australia’s Efforts to Improve Food Security for Aboriginal and Torres Strait Islander Peoples. Health and Human Rights 18:209.
- Dietitians Association of Australia 2013. Food Security for Aboriginal and Torres Strait Islander Peoples Policy. Canberra: DAA.
- Drewnowski A & Specter SE 2004. Poverty and obesity: the role of energy density and energy costs. The American Journal of Clinical Nutrition 79:6-16.
- Lee A & Ride K 2018. Review of nutrition among Aboriginal and Torres Strait Islander people. Australian Indigenous HealthInfoNet.
- Longstreet D, Heath D, Savage I, Vink R & Panaretto K 2008. Estimated nutrient intake of urban Indigenous participants enrolled in a lifestyle intervention program. Nutrition & Dietetics 65:128-33.
- Malseed C, Nelson A & Ware R 2014. Evaluation of a School-Based Health Education Program for Urban Indigenous Young People in Australia. Health:587-97.
- Menzies School of Health Research 2017. An Evaluation of the School Nutrition Projects in the Northern Territory Final Report. Department of the Prime Minister & Cabinet.
- National Health and Medical Research Council 2013. Australian Dietary Guidelines. Canberra: NHMRC.
- Passmore E, Shepherd B, Milat A, Maher L, Hennessey K, Havrlant R et al. 2017. The impact of a community-led program promoting weight loss and healthy living in Aboriginal communities: the New South Wales Knockout Health Challenge. BMC Public Health 17:951.
- Pratt S, DeMamiel M, Reye K, Huey A & Pope A 2014. Food Security in Remote Indigenous Communities. (ed., Department of the Prime Minister & Cabinet). Canberra: ANAO.
- Rowley KG, Daniel M, Skinner K, Skinner M, White GA & O'Dea K 2000. Effectiveness of a community‐directed ‘healthy lifestyle’ program in a remote Australian Aboriginal community. Australian and New Zealand journal of public health 24:136-44.
- Scelza BA 2012. Food scarcity, not economic constraint limits consumption in a rural Aboriginal community. Australian Journal of Rural Health 20:108-12.
- Schwarzman J, Nau T, Bauman A, Gabbe BJ, Rissel C, Shilton T et al. 2019. An assessment of program evaluation methods and quality in Australian prevention agencies. Health Promotion Journal of Australia.
- Thurber K, Banwell C, Neeman T, Dobbins T, Pescud M, Lovett R et al. 2017. Understanding barriers to fruit and vegetable intake in the Australian Longitudinal Study of Indigenous Children: a mixed-methods approach. Public Health Nutrition 20:832–47.
- Wang X, Ouyang Y, Liu J, Zhu M, Zhao G, Bao W et al. 2014. Fruit and vegetable consumption and mortality from all causes, cardiovascular disease, and cancer: systematic review and dose-response meta-analysis of prospective cohort studies. British Medical Journal 349:g4490.
- Welsby D, Nguyen B, O’Hara BJ, Innes-Hughes C, Bauman A & Hardy LL 2014. Process evaluation of an up-scaled community based child obesity treatment program: NSW Go4Fun®. BMC Public Health 14:140.