Key messages
- In the 2018–19 National Aboriginal and Torres Strait Islander Health Survey (NATSIHS), 17% (138,800) of Indigenous Australians had been admitted to hospital in the last 12 months. Among Indigenous Australians aged 15 and over, 86% (461,700) had consulted a general practitioner (GP) or specialist in the last 12 months.
- The rate of general practitioner Medicare items claimed by Indigenous Australians increased by 42% between 2003–04 and 2017–18.
- In 2017–18, the Medicare claim rate for specialist care among Indigenous Australians was highest in Major cities (860 per 1,000 population) and lowest in Very remote areas (161 per 1,000), the rate ranged from 24% to 70% lower than for non-Indigenous Australians across remoteness areas.
- Between July 2017 and June 2019, there were 613,665 hospitalisations (excluding dialysis) for Indigenous Australians, equivalent to 369 hospitalisations per 1,000 population. After adjusting for differences in the age structure between the two populations, Indigenous Australians were hospitalised at 1.3 times the rate of non-Indigenous Australians (470 and 354 hospitalisations per 1,000 population, respectively).
- Between July 2017 and June 2019, the rate of elective surgery for Indigenous Australians was lower compared with non-Indigenous Australians (61 and 82 per 1,000 population, based on age-standardised rates). Indigenous Australians waited longer for admission from elective surgery waiting lists than non-Indigenous Australians – with median public hospital waiting times for elective surgery of 49 and 40 days, respectively).
- The total rate of emergency department presentations was higher for Indigenous Australians compared with non-Indigenous Australians (25 and 13 per 1,000, respectively).
- In 2014, approximately 46,200 (6.9%) of Indigenous Australians lived in areas of low relative supply of general practitioners (GPs).
- About 30% of Indigenous Australians reported that they needed to but did not see a health care provider in the 12 months prior to the 2018–19 NATSIHS. About one-third (33%) of those who did not see a health care provider when they needed to reported a reason related to service availability or transport/distance: waiting time too long or the service was not available at time required (21%); they did not have transport or the service was too far away (13%); or the service was not available in the area (7%).
- There has been an overall increase in the number of Commonwealth-funded Indigenous primary health care organisations, from 108 in 1999–2000 to 198 in 2017–18.
- In 2017–18, the main service gaps reported by Indigenous primary health care organisations included mental health/social and emotional health and wellbeing (68%), youth services (54%) and alcohol, tobacco and other drug services (45%).
- Analysis of physical access of Indigenous populations to primary health care services (mainstream and Indigenous-specific primary health care services), identified 29 areas with at least 200 Indigenous Australians who had no Indigenous-specific primary health care services within one hour’s drive and relatively poor access to mainstream GP services based on drive times and local population needs.
- The 2006 Community Housing and Infrastructure Needs Survey (CHINS) reported that among 1,187 discrete Indigenous communities, 71% were at least 100 kilometres from the nearest hospital, 44% were at least 100 kilometres from the nearest Aboriginal Primary Health Care Centre and only around 10% of communities had an Aboriginal Primary Health Care Centre located within the community.
Why is it important?
Health care is considered ‘accessible’ when it is available at the right place and time, taking account of different population needs and the affordability of care. Access to appropriate, high-quality and timely health care throughout life is essential for improving health outcomes for Aboriginal and Torres Strait Islander people. For Indigenous Australians, factors such as cultural identity, family and kinship, country and caring for country, knowledge and beliefs, language and participation in cultural activities and access to traditional lands are also key determinants of health and wellbeing (AIHW 2022a).
Defining and measuring access to health care is complex as it encapsulates not only the availability and supply of services but also financial, organisational, social and cultural barriers that limit the use of services (Gulliford et al. 2002). Levesque et al. (2013) in conceptualising ‘access’ identified not only the characteristics of services that facilitate access (approachable, acceptable, available, affordable and appropriate) but also explored individuals’ abilities to engage with services such as the ability to perceive, seek, reach, pay and engage with services (Levesque et al. 2013).
While the causes of illness and injury for any community operate within broad environmental, social and personal factors, the health system has an important role in assisting with prevention through population health programs (see measure 3.03 Health promotion); providing an immediate response to acute illness and injury (see measure 1.02 Top reasons for hospitalisation); and protect good health through screening, early intervention and treatment (see measures 3.04 Early detection and early treatment and 3.05 Chronic disease management) (Dwyer et al. 2004). However, for Indigenous Australians, inequalities in access to services mean that the benefits of health care advances have not been shared equally. Indigenous Australians face barriers that other groups do not.
Indigenous Australians experience significantly poorer health outcomes than non-Indigenous Australians. Inequalities in health care access and use are considered important drivers of this difference (OECD 2009). Therefore, access to health care commensurate with the level of need is therefore essential to closing the gap in life expectancy between Indigenous and non-Indigenous Australians.
The National Aboriginal and Torres Strait Islander Health Plan 2021-2031 (the Health Plan), released in December 2021, provides a strong overarching policy framework for Aboriginal and Torres Strait Islander health and wellbeing. The Health Plan was developed in genuine partnership with Aboriginal and Torres Strait Islander leaders and is the first national health document to address the health targets and priority reforms of the National Agreement on Closing the Gap.
Implementation of the Health Plan aims to drive structural reform across the health system towards models of care that are prevention and early intervention focused, with greater integration of care systems and pathways across primary, secondary and tertiary care.
The Health Plan is discussed further in the Implications section of this measure.
Data findings
Reported use of services
According to the 2018–19 National Aboriginal and Torres Strait Islander Health Survey (NATSIHS), in the past two weeks, 23% (186,400) of Indigenous Australians had consulted a doctor or specialist, 22% (181,700) had consulted other health professionals, 7% (55,100) had visited casualty/outpatient services and 5% (38,000) had seen a dentist. In the previous 12 months, 17% (138,800) had been admitted to hospital (Table D3.14.1). Of Indigenous Australians aged 15 and over, 86% (461,700) had consulted a general practitioner (GP) or specialist in the last 12 months (Table D3.03.3).
Indigenous Australians were more likely to have visited a doctor in the last 12 months if they had the following conditions (compared with those without the conditions): a disability (1.7 times), three or more long-term health conditions (3.2 times) and/or high/very high psychological distress (1.4 times) (Table D3.14.10).
Services claimed through Medicare
In 2017–18, over 9.5 million Medicare claims were made for services provided to Indigenous Australians, of which 4.6 million were for GP services (note: not all care delivered through Indigenous primary health care services can be claimed through Medicare) (Table D3.14.23).
Indigenous females claimed Medicare services at 1.6 times the rate as of Indigenous males (18,460 and 11,826 per 1,000 population, respectively). Non-Indigenous females claimed Medicare services at 1.4 times the rate of non-Indigenous males (Table D3.14.42).
While the burden of disease of Indigenous Australians is more than double that of non-Indigenous Australians, Indigenous Australians use GP services at a rate that is only slightly higher to that of non-Indigenous Australians. In 2017–18, Indigenous Australians’ rate of GP service use—as indicated by Medicare claims for GP items—was 1.2 times that of non-Indigenous Australians (Table D3.14.23).
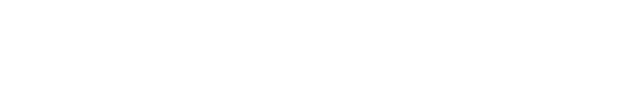
The difference between the death rates of Indigenous and non-Indigenous Australians (expressed as a ratio) was noticeably higher between ages 25–64 (Table D1.22.2, Figure 3.14.2). However, Indigenous Australians’ rate of GP service use compared with non-Indigenous Australians’ rate of use (expressed as a ratio) did not differ greatly across age groups. This should be interpreted with caution as the underlying number of deaths is small (Table D3.14.26, Figure 3.14.1).
Figure 3.14.1: Comparing mortality rate ratios (2014–2018) with accessing MBS GP services rate ratio (2017–18), by age group
Source: Table D1.22.2. AIHW and ABS analysis of the ABS Causes of Death Collection. Table D3.14.26. AIHW analysis of Medicare Data.
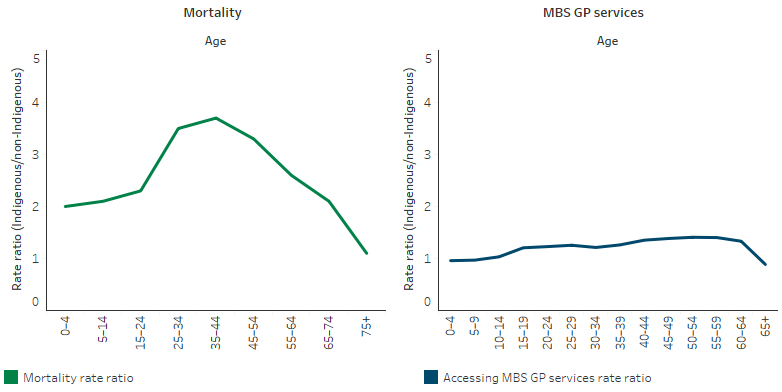
For GP services, Indigenous Australians claimed at a lower rate as remoteness increased, reflecting that many Indigenous Australians live in areas with challenges to accessing services (AIHW 2014, 2015) (Table D3.14.37, Figure 3.14.2).
Figure 3.14.2: Age-standardised rate of GP MBS services claimed through Medicare, by Indigenous status and remoteness, 2017–18
Source: Table D3.14.37. AIHW analysis of Medicare Data.
Medicare item claims for specialist and psychologist items were lower for Indigenous than non-Indigenous Australians. There was a clear gradient, reducing by remoteness, in the rate of Medicare service claims for GP, allied health and specialist services for both Indigenous and non-Indigenous Australians. Against this gradient, the rate of claims for nurse/Aboriginal health worker services increased by remoteness for Indigenous Australians. This also reflects types of services available in remote areas.
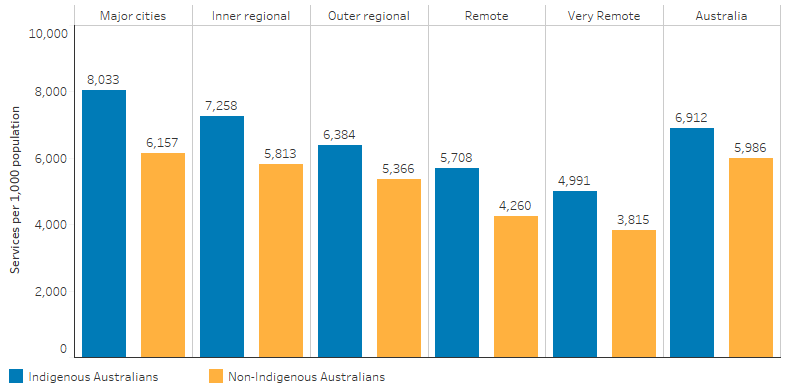
The Medicare claim rate for specialist care among Indigenous Australians was the highest in Major cities (860 per 1,000 population) and lowest in Very remote areas (161 per 1,000), and the rate was between 24%–70% lower than for non-Indigenous Australians in all remoteness areas (Table D3.14.37, Figure 3.14.3).
Figure 3.14.3: Age-standardised rate of specialist MBS services claimed through Medicare, by Indigenous status and remoteness, 2017–18
Source: Table D3.14.37. AIHW analysis of Medicare Data.
In 2017–18, the most common Medicare items claimed by Indigenous Australians were for standard GP consultations (2.5 million) and pathology services (3.2 million). Out-of-pocket costs for services claimed through Medicare were lower for Indigenous Australians (8% of fees claimed) than non-Indigenous Australians (23% of fees claimed).
For Indigenous Australians, out-of-pocket costs were minimal (0% or under 0.1%) for Aboriginal Health Worker items, Indigenous health checks, team care arrangements (TCAs) and GP management plans (GPMPs). Out-of-pocket costs were higher for specialists (24%), diagnostic procedures and investigations (for example, electrocardiography, allergy testing and audiograms) (10%), allied health (10%) and diagnostic imaging services (for example, X-rays and ultrasounds) (6%) (Table D3.14.23).
Indigenous primary health care organisations
In 2017–18, Commonwealth-funded Indigenous primary health care organisations were asked to select the top five service gaps faced by their patients. Access to services was reported as a top five health service gap by 33% of organisations (Table D3.14.53). The proportion of organisations reporting ‘access to services’ as a top five health service gap varied by jurisdiction from 21% in Queensland to 57% in Tasmania (Table D3.14.54).
The main service gaps reported by Indigenous primary health care organisations included mental health/social and emotional health and wellbeing (68%), youth services (54%) and alcohol, tobacco and other drug services (45%) (Table D3.14.55). Health service challenges reported by these organisations included recruitment, training and support of Indigenous staff (71%), staffing levels (63%) and staff retention/turnover (54%) (Table D3.14.56).
Hospital care
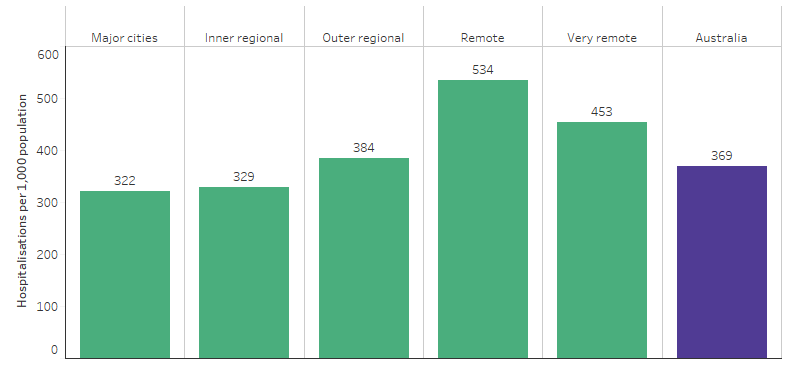
Between July 2017 and June 2019, there were 613,665 hospitalisations (excluding dialysis) for Indigenous Australians, equivalent to 369 per 1,000 population. After adjusting for differences in the age structure between the two populations, Indigenous Australians were hospitalised at 1.3 times the rate of non-Indigenous Australians (470 and 354 per 1,000 population, respectively) (Table D1.02.1). Across remoteness areas, hospitalisation rates for Indigenous Australians varied from 322 per 1,000 population in Major cities to 534 per 1,000 population in Remote areas (see also measure 1.02 Top reasons for hospitalisation) (Table D1.02.3, Figure 3.14.4).
Figure 3.14.4: Hospitalisation rates of Indigenous Australians (excluding dialysis), by remoteness, July 2017 to June 2019
Source: Table D1.02.3. AIHW analysis of National Hospital Morbidity Database.
Elective surgery
Between July 2017 and June 2019, after adjusting for differences in the age-structure of the population, the overall rate of elective surgery for Indigenous Australians was lower compared with non-Indigenous Australians (61 and 82 per 1,000 population, respectively) (Table D3.14.52). In this period, there were 56,176 hospitalisations from public hospital elective surgery waiting lists for Indigenous Australians, representing 3.8% of hospital admissions from waiting lists for elective surgery (Table D3.14.51).
Indigenous Australians waited longer for admission from elective surgery waiting lists than non-Indigenous Australians. The median public hospital waiting time for elective surgery was 49 days for Indigenous Australians compared with 40 days for non-Indigenous Australians (Table D3.14.51). Between July 2017 to June 2019, the median wait time for Indigenous Australians was highest for septoplasty (procedure to fix a deviated nasal septum—302 days) and total knee replacement (270 days) (Table 3.14.57).
Emergency care
Between July 2017 and June 2019, there were 1,124,770 emergency department presentations for Indigenous Australians (6.8% of all emergency department presentations, excluding patient records that did not have an Indigenous status) (Table D3.16.6).
In 2020–21, the median waiting time in emergency departments was the same for Indigenous Australians as for non-Indigenous Australians (both 18 minutes). That is, 50% of patients who presented to the emergency department commenced clinical care (or completed their episode, or were admitted to hospital) after waiting 18 minutes. Clinical care is defined as the assessment and treatment phase of care. The proportion of Indigenous Australian presentations seen on time was similar to that for non-Indigenous (72% and 71% respectively) (AIHW 2022b).
In 2020–21, across triage categories, 100% of Indigenous Australians requiring ‘resuscitation’ (immediate) care were seen on time (within 2 minutes), as were 72% of those requiring emergency care (within 10 minutes); 66% for urgent care (within 30 minutes) and 73% for semi-urgent (within 60 minutes). For non-urgent patients, 92% were seen on time (within 2 hours) (AIHW 2022b).
The total rate of emergency hospitalisations was higher for Indigenous Australians compared with non-Indigenous Australians (25 and 13 per 1,000 population, respectively) (Table D3.14.52).
Between July 2017 to June 2019, the average length of stay for overnight acute hospitalisations was lower for Indigenous Australians compared with non-Indigenous Australians (3.7 and 4.0 days, respectively) (Table D3.14.58).
The Royal Flying Doctor Service (RFDS) provides emergency and other health care for those living in Remote and Very remote areas. Between July 2013 and December 2015, the RFDS conducted 17,606 aeromedical retrievals for Indigenous Australians (over one-quarter of all retrievals). Of these the 5 most common reasons for aeromedical retrieval included:
- Injury and poisoning and certain other consequences of external causes (18% of all retrievals)
- Diseases of the circulatory system (14%)
- Diseases of the respiratory system (13%)
- Diseases of the digestive system (7.8%) and
- Pregnancy, childbirth and the puerperium (7.2%)
Together the top 3 reasons for aeromedical retrieval accounted for almost half of all retrievals (45%) (Bishop et al. 2016).
Palliative care
Between July 2017 and June 2019, there were 2,232 hospitalisations for palliative care for Indigenous Australians, equivalent to 1.3 per 1,000 population. After adjusting for differences in the age structure between the two populations, Indigenous Australians were hospitalised for palliative care at 1.8 times the rate of non-Indigenous Australians (2.8 and 1.5 per 1,000 population, respectively). Indigenous patients accounted for 2.5% of all hospitalisations for palliative care (Table D3.14.48).
For Indigenous Australians, the hospitalisation rate for palliative care varied across jurisdictions, ranging from 1.5 per 1,000 population in New South Wales to 0.7 per 1,000 population in Tasmania (Table D3.14.48).
The rate of hospitalisation for palliative care among Indigenous Australians was lowest for those living in Very remote areas (1.0 hospitalisations per 1,000 population, followed by those in Major cities and Inner regional areas (1.2 and 1.3 per 1,000 population respectively), with the highest rates in Outer regional and Remote areas (1.7 and 1.8 per 1,000 population, respectively) (Table D3.14.49).
In 2017–18, palliative care was a health service gap for 15% of Commonwealth-funded Indigenous primary health care organisations (Table D3.14.55).
Reported barriers
In the 2018–19 NATSIHS, 30% (243,700) of Indigenous Australians reported that they needed to but did not see a health care provider in the previous 12 months. This varied by the type of service: 19% (146,700) did not go to a dentist; 13% (102,000) a doctor; 10% (46,200) a counsellor; 9% (73,000) other health professional; and 6% (50,600) did not go to a hospital when needed.
Indigenous Australians living in non-remote areas (32%) were more likely to report not seeking care when needed than those living in remote areas (23%). The reasons for not seeking various health care when needed varied by type of service. Cost was the main reason for not seeking care for some services (dentist, other health provider), for others waiting time was a more important barrier (doctor, hospital).
With more than one response allowed, among those who did not see a health care provider when they needed in the previous 12 months, the most common reasons were being too busy (36%, including work, personal or family responsibilities), cost (34%) and a dislike of the service (23%).
Logistical reasons such as service availability and/or transport/distance were reported by 1 in 3 (33%) Indigenous Australians who had not seen a health care provider when they needed, including waiting times were too long or the service was not available at the time required (21%), transport/distance (13%), and service not available in the area (7%).
Indigenous Australians living in non-remote areas were more likely to report being too busy, cost and disliking the service (37%, 36% and 23%, respectively) as barriers than those in remote areas (30%, 21% and 15%, respectively). Indigenous Australians in remote areas were more likely to report logistical reasons as a barrier (54%) than those living in non-remote areas (29%). Of those, service availability and transport/distance were more frequently reported as barriers in remote than non-remote areas (22% compared with 4.7% and 25% compared with 11%) (Table D3.14.14).
Among those who did not see a doctor when needed, the most common reasons were being too busy (33%) and decided not to seek care (28%). Cost was a less commonly reported barrier (7%). Logistical reasons such as service availability and/or transport/distance were reported by 29% of Indigenous Australians who had not seen a doctor when they needed – specifically, waiting time too long/service not available at the time required (16%); transport/distance (14%), and service not available in area (2%). Other reasons included: dislikes service/professional or is embarrassed/afraid (11%); felt service would be inadequate (10%); does not trust service provider (4%); and discrimination/not culturally appropriate/language problem (1%).
A larger proportion of Indigenous Australians living in non-remote areas (14%) did not go to the doctor when they needed to, compared with those in remote areas (8%). Reasons most reported for not going to the doctor when needed were similar in non-remote and remote areas, though the greatest differences between non-remote and remote areas were:
- deciding not to seek care (31% compared with 9.3%)
- service not available in area (0.9% compared with 10%) (Table D3.14.14).
A larger proportion of those living in non-remote areas (20%) did not go to the dentist when they needed to than those in remote areas (15%). Cost was reported as the major barrier to accessing dentists (reported by 42% of those who did not access a dentist when needed, 32% in relation to children) in both non-remote (44%) and remote areas (29%). Other key barriers included:
- disliking service/professional, embarrassed or afraid (23% in non-remote areas compared with 13% in remote)
- waiting time too long or not available at time required (13% in non-remote areas compared with 24% in remote areas).
Private health insurance
In 2018–19, in non-remote areas, 21% of Indigenous Australians aged 15 and over were covered by private health insurance (similar to 20% in 2012–13), compared with 58% of non-Indigenous Australians (Table D3.14.19). The rate of private health insurance cover was similar for Indigenous males (20%) and females (21%) (Table D3.14.17). From July 2017 to June 2019, 12% of hospitalisations with a procedure recorded for Indigenous Australians occurred in private hospitals, compared with 51% for non-Indigenous Australians (Table D3.06.6).
Service/provider availability
In 2015, the full-time equivalent (FTE) rates for medical practitioners working as clinicians varied from 442 per 100,000 population in Major cities to 263 per 100,000 in Remote/Very remote areas. This particularly reflects the pattern for specialists. However, for GPs, the FTE rate was highest in Remote/Very remote areas (136 per 100,000 population) compared with Major cities (112 per 100,000) (AIHW 2016a). For nurses, the FTE rate ranged from 1,083 per 100,000 population in Outer regional areas to 1,219 per 100,000 in Remote areas (AIHW 2016b).
Analysis of the distribution of the clinical health workforce in relation to the Indigenous Australian population found that a higher proportion of Indigenous Australians live in areas with lower health workforce access scores (based on the Geographically-adjusted Index of Relative Supply) than non-Indigenous Australians. This index is used to look at the geographic supply of the clinical health workforce in seven key professions with particular relevance to Indigenous Australians, and to identify areas in Australia that face particular supply challenges. It was estimated that, in 2014, approximately 46,200 Indigenous Australians live in areas of low relative supply of GPs (6.9% of the Indigenous population compared with 0.5% of the non-Indigenous population) (AIHW 2016c).
Patient experience
Accessing the health system can be affected by patient experience. In the 2018–19 NATSIHS, 23% (around 116,200) of Indigenous Australians aged 15 and over reported they had been treated unfairly in the previous 12 months because they are Indigenous. Around 14% (69,700) of Indigenous Australians reported that they avoided situations due to past unfair treatment. Of those, 13% (8,900) had avoided seeking care from doctors, nurses or other staff at hospitals or doctor’s surgeries because of previous unfair treatment (Table D3.08.17).
Indigenous Australians aged 15 and over in non-remote areas reported their GP or specialist in the previous 12 months always or often: showed them respect (91%; 312,690), listened carefully to them (89%; 305,240), and spent enough time with them (88%; 300,760) (Table D3.08.21).
See also Module 2 in Cultural safety in health care for Indigenous Australians: monitoring framework.
Change over time
MBS services claimed
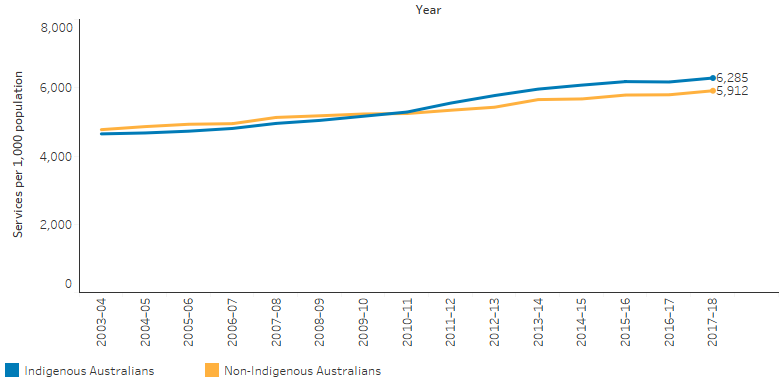
Between 2003–04 and 2017–18, the rate of GP Medicare items claimed for Indigenous Australians increased by 42% and has been slightly higher than the rate for non-Indigenous Australians since 2010–11 (Table D3.14.20, Figure 3.14.5).
Figure 3.14.5: Age-standardised rates of GP MBS services claimed through Medicare, by Indigenous status, 2003–04 to 2017–18
Source: Table D3.14.20. AIHW analysis of Medicare Data.
The rate of Medicare claims for health assessment items for Indigenous Australians increased since 2009–10, as have claims for TCA and GPMP services (Table D3.04.3, Table D3.05.1). In 2017–18, the rate for these chronic disease management items (GPMPs and TCAs combined) for Indigenous Australians was 1.4 times as high as non-Indigenous Australians (267 per 1,000 population compared with 185 per 1,000) (Table D3.14.23).
Over the period from 2009–10 to 2017–18 there was no significant change in the age-standardised rate of Medicare claims for specialist care among Indigenous Australians.
Indigenous primary health care organisations
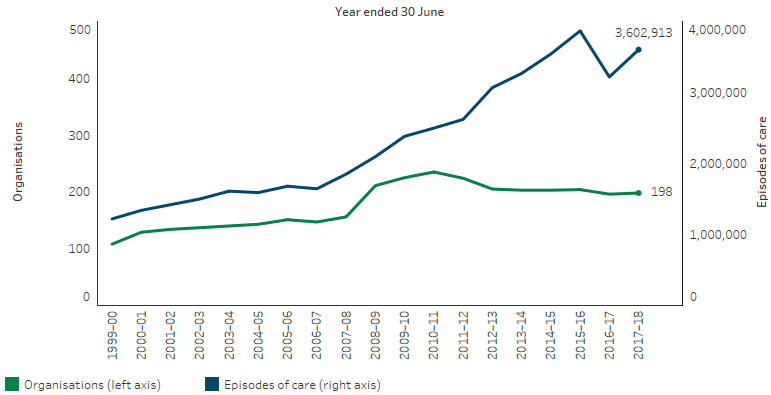
There has been an overall increase in the number of Commonwealth-funded Indigenous primary health care organisations, from 108 in 1999–2000 to 198 in 2017–18. However, over the decade 2008–09 to 2017–18, the number of organisations decreased from 211 to 198 (Table D3.14.47, Figure 3.14.6).
Over the period 1999–2000 to 2017–18, episodes of health care for clients of these organisations have increased from 1.2 million to 3.6 million (Figure 3.14.6), and full‑time equivalent (FTE) staff (both paid by the service and visiting) more than tripled from 2,300 to 8,215 (Table D3.14.47).
Figure 3.14.6: Number of organisations and episodes of care in Indigenous primary health care services, 1999–2000 to 2017–18
Source: Table D3.14.47. AIHW analysis of Service Activity Reporting and AIHW Online Services Report data collections.
Research and evaluation findings
Gulliford and others (2002) and Ware (2013) outlined the following requirements for health care access:
- availability of adequate services
- addressing factors that may act as barriers to accessibility of health services, such as affordability and geographic accessibility
- effective health services that deliver acceptable health outcomes
- services that are appropriate to varying health needs and cultural settings (Gulliford et al. 2002; Ware 2013).
A review by Levesque and others (2013) built on this accessibility frame to include the ability or power of the population to utilise services, including the ability to perceive health care needs, seek, reach, pay and engage in order to obtain health care (Levesque et al. 2013).
The availability of health services relates to the location of facilities and timely provision of professional services. The 2006 Community Housing and Infrastructure Needs Survey (CHINS) reported that among 1,187 discrete Indigenous communities, 71% were at least 100 kilometres from the nearest hospital, 44% were at least 100 kilometres from the nearest Aboriginal Primary Health Care Centre and only around 10% of communities had an Aboriginal Primary Health Care Centre located within the community. Around two-thirds of communities could access an Indigenous health worker daily and around half had daily access to a registered nurse. Less than 10% of these communities could access a doctor on a daily basis (ABS 2006). Francis and others (2020) reviewed the availability of inpatient hospital services in 533 smaller Australian towns (population 1,000 to 4,999), and found 14 towns with a population for which more than 80% were Indigenous Australian. These 14 towns were less likely than other towns to either have a hospital or be within 50 kilometres of one (Francis et al. 2020).
The AIHW has modelled how Indigenous Australians’ physical access to primary health care services (Indigenous-specific primary health care services and other GP-based primary health services) varies geographically across Australia (AIHW 2014, 2020). Analysis of physical access to primary health care services (mainstream and Indigenous-specific primary health care services), identified 29 areas with at least 200 Indigenous Australians who had no Indigenous-specific primary health care services within one hour’s drive and relatively poor access to mainstream GP services based on drive times and local population needs (AIHW 2020). Of these, 14 were in Inner and outer regional areas, and 15 were in Remote and very remote areas. See Table 6.2 in the Health performance Framework – summary report 2023: Access to primary health care for a list of these specific SA2 areas.
An earlier AIHW analysis found that health outcomes improved with better access to GPs in areas with relatively high predicted need for primary health care than in areas with low predicted need. Indigenous Australians experience a general pattern of worsening access to GPs relative to need with increasing remoteness; this pattern is less strong for non-Indigenous Australians (AIHW 2014). McGrail and Humphreys (2015) studied spatial disparities of access to primary health care across rural Australia and also found that more remote areas experienced poorer access than more populated rural areas. However, they also found numerous rural areas close to cities with very poor access (McGrail & Humphreys 2015).
Issues relating to the accessibility of health services go beyond the physical distance to include transport disadvantage, or ongoing difficulties associated with access to transport (Rosier 2011) and relates to the use of both public and private transport. Currie (2009) noted that the low density of Australian cities and associated travel distances make private car ownership a logical requisite for work, leisure and service access. However, people on lower incomes face more prohibitive purchase and maintenance costs, resulting in less equity of access to private car access (Currie 2009). Outer-urban or “fringe” areas tend to have greater transport disadvantage than inner urban areas. Rosier and McDonald (2011) noted that transport disadvantage is more pronounced in those outer-urban areas with poor public transport, low-incomes and long distances for work and service access (Rosier 2011). Madill and others (2018) also found substantially higher travel times to diabetic health services for people living in outer-urban areas of Melbourne compared with those living in established areas (Madill et al. 2018). Transport disadvantage is also experienced more by specific groups including people with a disability or low incomes, and Indigenous Australians in remote areas with limited access to both public transport and private cars (Rosier 2011).
The affordability of health care includes financial expenses for health services, pharmaceuticals (see measure 3.15 Access to prescription medicines), accommodation, rehabilitation and travel. These also incur a time-cost, and this is associated with disruption to community or family. The lower than average incomes of Indigenous Australians limit the ability to contribute to the financial costs of health care through private expenditure and this limits the accessibility of health care. Tynan and others (2020) found in a rural Indigenous Australian community that Indigenous Australians have a higher rate of oral disease and a lower rate of accessing dental health services than non-Indigenous Australians. They found that lower use of dental care was due to difficulties in accessing care and cost. However, importantly, oral health remained a priority for members of the community (Tynan et al. 2020).
The appropriateness of health services affects the uptake of care by Indigenous Australians. Cultural security is an essential requirement of health services and across the healthy system without which Indigenous Australians can suffer emotional and physical discomfort, which then leads to insufficient use of health services and poorer health outcomes (Coffin 2007). Cultural security and safety is essential to all aspects of the health system and health providers should develop an understanding of cultural security and safety. This should be applied to Indigenous patients from the start of health care provision. Yashadhana and others (2020) interviewed adults with diabetes in four remote Indigenous communities and found limited access to health information and interpreters, language barriers, distrust of health providers and limited cultural responsiveness among non-Indigenous clinicians. The study recommended increased access to Indigenous language interpreters and cultural brokers, understandable and culturally sensitive diabetic eye health information and cultural responsivity training for non-Indigenous health care providers (Yashadhana et al. 2020).
Research from India has shown that the availability and affordability of services are not enough to achieve engagement with marginalised or culturally diverse groups such as local indigenous people. The study found that although services were clinically sound and subsidised, they did not acknowledge the cultural and traditional values of the community they were serving and this led to resistance from the community (George et al. 2020). Although this was a study in a different cultural setting it highlights the generalisable importance of getting the basics right for culturally safe service delivery in order to build trust and engagement from the client population.
In 2017, the Australian Government announced it was undertaking a national evaluation of its investment in Aboriginal and Torres Islander primary health care which occurs primarily through the Indigenous Australians’ Health Programme (IAHP). The evaluation has a whole of system, person-centred approach that not only focuses on the appropriateness and effectiveness of the IAHP, but its interactions and influence on other parts of the primary health care and wider health system. It is drawing on the perspectives of Aboriginal and Torres Strait Islander stakeholders at different levels of the system and aims to facilitate learning across these levels. This evaluation is composed of 2 separate pathways, one looking at monitoring and evaluation, and the second looking at economic evaluation.
The monitoring and evaluation pathway is framed by 4 key evaluation questions:
- How well is the IAHP enabling the primary health care system to work for Aboriginal and Torres Strait Islander people?
- What difference is the IAHP making to the primary health care system?
- What difference is the IAHP making to the health and wellbeing of Aboriginal and Torres Strait Islander people?
- How can faster progress be made towards improving the health and wellbeing of Aboriginal and Torres Strait Islander people?
The Department of Health and Aged Care is working with the IAHP Yarnes Health Sector Co-design Group on finalising the evaluation in 2024.
Phase 1 of the economic evaluation pathway has been published (Department of Health 2018) and showed:
- The analysis of national data for this project found a preventative effect upon hospitalisations from ACCHSs care.
- Provision of care through mainstream services is likely to be associated with worse health outcomes for Indigenous Australians because mainstream services provide a less comprehensive and less integrated approach.
- Indigenous Australians may face financial difficulties in accessing mainstream services (Dalton et al. 2018).
Implications
Analysis has shown an increase in health assessments, GPMPs and TCAs claimed through Medicare since the implementation of enhanced Indigenous chronic disease initiatives in 2009. There have also been general increases in episodes of care provided through Indigenous primary health care services (with some exceptions). These improvements, while encouraging, have not yet dramatically reduced the gap in death rates between Indigenous and non-Indigenous Australians. Indigenous Australians currently experience significantly poorer health, and a rate of access to health services 2–3 times the non-Indigenous rate should be expected in order to meet the need for health care, but this is not the case. This is illustrated by three stark contrasts in the data:
- The rate of Medicare claims for chronic disease management items for Indigenous Australians is only 1.4 times as high as non-Indigenous Australians despite mortality rate ratios being higher.
- The age-specific gap (relative to non-Indigenous Australians) in mortality rate is higher than the age specific gap in Medicare claims for GP service use.
- The gradient by remoteness for Medicare claims for specialists is present for both Indigenous and non-Indigenous Australians, but there is also a widening of the gap, which suggests the barriers to accessing specialist health care for Indigenous Australians in Remote and Very remote areas have a greater effect than those faced by non-Indigenous Australians in those areas.
These contrasts are crude measures but point to a continued underutilisation of appropriate and timely health care by Indigenous Australians compared with their level of need. Lessons to be gained from the evaluation of the Indigenous Australians’ Health Programme will be particularly important in the coming years in identifying service gaps.
The data also show that Indigenous Australians have lower levels of private health insurance, are more likely to use public hospital services and have lower rates of elective and preventative surgery. This suggests that a range of factors relating to the accessibility, affordability and appropriateness of health care need greater attention.
A significant body of work over the past two decades has sought to raise awareness and embed concepts of cultural respect in the Australian health system which are fundamental to improving access to quality and effective health care and improve health outcomes for Indigenous Australians. There has been a longstanding commitment by Australian governments to enable this. The Cultural Respect Framework 2016–2026 plays a key role in reaffirming this commitment and provides a nationally consistent approach (AHMAC 2017). The Aboriginal and Torres Strait Islander Health Performance Framework plays a role in monitoring this commitment across several measures (see measure 3.08 Cultural competency). Monitoring is also supported by the Cultural safety in health care for Indigenous Australians: monitoring framework which covers three domains: how health-care services are provided, Indigenous patients’ experience of health care, and measures regarding access to health care (AIHW 2022c). The 2022 Cultural safety report showed that a commitment to achieving culturally safe health care by Indigenous-specific health care organisations was 95% in 2017-18, an increase from 86% in 2012-13, while noting the lack of data available for reporting on the policies and practices of mainstream health services (AIHW 2022c).
There is a need to address recruitment and retention of staff in rural and remote areas (see measure 3.22 Recruitment and retention of staff), ensure the cultural competency of services (see measure 3.08 Cultural competency), and consider service delivery options to overcome distance, cost and complicated referral processes.
Having Indigenous Australians employed within health care services has been identified as an enabler to developing relationships with patients and promoting access (Askew et al. 2014) (see measure 3.12 Aboriginal and Torres Strait Islander people in the health workforce).
The National Aboriginal and Torres Strait Islander Health Workforce Strategic Framework and Implementation Plan 2021–2031 (National Workforce Plan) aims to increase representation of Indigenous Australians in all health roles and locations across Australia. It sets an ambitious target for Indigenous Australians to represent 3.43% of the national health workforce by 2031. The National Workforce Plan commits governments to work in partnership with Indigenous Australians to meet this target and to foster a culturally safe and responsive health system.
The vision of the Health Plan is for Indigenous Australians to enjoy long, healthy lives that are centred in culture, with access to services that are prevention-focused, culturally safe and responsive, equitable and free of racism. Priority 9 of the Health Plan aims to improve the health system for Indigenous people to access person-centred and family-centred care. The Health Plan affirms that Indigenous Australians’ health and wellbeing is the whole community’s responsibility and collaboration and coordination is needed across all services and aspects of health care delivery. This means that in addition to the continued focus on strengthening the ACCHS sector, there must also be a focus on greater access to mainstream primary health care services across the broader health system. These mainstream services must be capable of providing high quality, culturally safe, trauma-aware, healing-informed and responsive care and be accountable to Indigenous Australians and their communities. This includes care provided through government clinics, private general practitioners and mainstream community health services.
The Health Plan also recognises that acute care settings must be accessible, culturally safe and responsive to address the gaps between Indigenous Australians’ and non-Indigenous Australians’ experiences in hospitals, including addressing the gap in surgery procedures, wait times and the rates of early discharge or discharge against medical advice. Addressing these gaps will require hospitals to implement strategies to better deliver holistic, culturally safe and responsive models of care, for example by improving employment of traditional health workers to provide complementary care and having care coordination pathways with Aboriginal Community Controlled Health Services (ACCHSs) to deliver care on Country.
As part of the National Agreement on Closing the Gap, the health sector was identified as one of four initial sectors for joint national strengthening effort and the development of a 3-year Sector Strengthening Plan. The Health Sector Strengthening Plan (Health-SSP) was developed in 2021, to acknowledge and respond to the scope of key challenges for the sector, providing 17 transformative sector strengthening actions. Developed in partnership with the Aboriginal and Torres Strait Islander community-controlled health sector and other Aboriginal and Torres Strait Islander health organisations, the Health-SSP will be used to prioritise, partner and negotiate beneficial sector-strengthening strategies.
References
-
ABS (Australian Bureau of Statistics) 2006. 4710.0 - Housing and Infrastructure in Aboriginal and Torres Strait Islander Communities, Australia, 2006. (ed., Australian Bureau of Statistics). Canberra.
-
AHMAC (Australian Health Ministers' Advisory Council) 2017. Cultural Respect Framework 2016-2026 for Aboriginal and Torres Strait Islander health. Vol. 17 (ed., Council of Australian Governments). Canberra: AHMAC.
-
AIHW (Australian Institute of Health and Welfare) 2014. Access to primary health care relative to need for Indigenous Australians. Cat. no. IHW 128. Canberra: AIHW.
-
AIHW 2015. Spatial variation in Aboriginal and Torres Strait Islander people’s access to primary health care. Cat. no. IHW 155. Canberra: AIHW.
-
AIHW 2016a. Medical practitioners workforce 2015. Cat. no. WEB 140. Canberra: AIHW.
-
AIHW 2016b. Nursing and midwifery workforce 2015. Cat. no. WEB 141. Canberra: AIHW.
-
AIHW 2016c. Spatial distribution of the supply of the clinical health workforce 2014: relationship to the distribution of the Indigenous population. Cat. no. IHW 170. Canberra: AIHW.
-
AIHW 2020. Aboriginal and Torres Strait Islander Health Performance Framework 2020 summary report. Cat. no. IHPF 2. . Canberra: AIHW.
-
AIHW 2022a. Australia's Health: data insights. Vol. AUS 240 (ed., AIHW). Canberra: Australian Government, 105-52.
-
AIHW 2022b. Emergency Department Care. AIHW. Viewed 2 September 2022.
-
AIHW 2022c. Cultural safety in health care for Indigenous Australians: monitoring framework. Canberra.
-
Askew D, Brady J, Brown A, Cass A, Davy C, DeVries J et al. 2014. To your door: Factors that influence Aboriginal and Torres Strait Islander peoples seeking care. Sydney: KVC.
-
Bishop L, Laverty M & Gale L 2016. Providing aeromedical care to remote Indigenous communities. Canberra: Royal Flying Doctor Service
-
Coffin J 2007. Rising to the challenge in Aboriginal health by creating cultural security. Rising to the Challenge in Aboriginal Health by Creating Cultural Security 31:22-4.
-
Currie G 2009. Australian Urban Transport and Social Disadvantage. Australian Economic Review 42:201-8.
-
Dalton A, Lal A, Mohebbi M & Carter R 2018. Economic Evaluation of the Indigenous Australians’ Health Programme Phase 1 Report. (ed., Health Do). Canberra.
-
Dwyer J, Silburn K & WIlson G 2004. National Strategies for Improving Indigenous Health and Health Care. Vol. Volume 1 (ed., Office for Aboriginal and Torres Strait Islander Health). Canberra: OATSIH.
-
Francis JR, Verma S & Bonney D 2020. Disparity in distribution of inpatient hospital services in Australia. Australian and New Zealand journal of public health 44:326-.
-
George MS, Davey R, Mohanty I & Upton P 2020. “Everything is provided free, but they are still hesitant to access healthcare services”: why does the indigenous community in Attapadi, Kerala continue to experience poor access to healthcare? International Journal for Equity in Health 19:105.
-
Gulliford M, Figueroa J, Morgan M, Hughes D, Gibson B, Beech R et al. 2002. What does 'access to health care' mean? Journal of health services research & policy 7:186-8.
-
Levesque J-F, Harris MF & Russell G 2013. Patient-centred access to health care: conceptualising access at the interface of health systems and populations. International Journal for Equity in Health 12:18.
-
Madill R, Badland H, Mavoa S & Giles-Corti B 2018. Comparing private and public transport access to diabetic health services across inner, middle, and outer suburbs of Melbourne, Australia. BMC health services research 18:286.
-
McGrail MR & Humphreys JS 2015. Spatial access disparities to primary health care in rural and remote Australia. Geospat Health 10:358.
-
OECD 2009. Measuring disparities in health status and in access and use of health care in OECD countries. OECD Publishing.
-
Rosier KaM, M 2011. The relationship between transport and disadvantage in Australia. Australian Institute of Family Studies.
-
Tynan A, Walker D, Tucker T, Fisher B & Fisher T 2020. Factors influencing the perceived importance of oral health within a rural Aboriginal and Torres Strait Islander community in Australia. BMC Public Health 20:514.
-
Ware VA 2013. Improving the accessibility of health services in urban and regional settings for Indigenous people. (ed., Australian Institute of Health and Welfare & Australian Institute of Family Studies). Canberra: Closing the Gap Clearinghouse.
-
Yashadhana A, Fields T, Blitner G, Stanley R & Zwi AB 2020. Trust, culture and communication: determinants of eye health and care among Indigenous people with diabetes in Australia. BMJ Global Health 5:e001999.
Related Measures
- 1.02 Hospitalisation trends and leading causes
- 2.13 Transport
- 3.03 Health promotion
- 3.04 Early detection and early treatment
- 3.05 Chronic disease management
- 3.08 Cultural competency
- 3.12 Aboriginal and Torres Strait Islander people in the health workforce
- 3.17 Regular general practitioner or health service
- 3.21 Expenditure on Aboriginal and Torres Strait Islander health compared to need
- 3.22 Recruitment and retention of staff