
Education
A person’s educational qualifications can influence their health status and health outcomes. Higher levels of education can lead to:
- greater health literacy (a person’s ability to find, understand, and apply health information), which can have a direct impact on a person’s health
- better prospects for employment and income, which can help people access good quality housing, healthy food, and health care services.
Health also influences education. Poor health through life, and health conditions such as vision and hearing impairment (especially in childhood) can disrupt a person’s schooling and affect their ability to learn (Department of Prime Minister and Cabinet 2020).
The importance of education is also reflected in four Closing the Gap targets:
- Target 4: By 2031, increase the proportion of Aboriginal and Torres Strait Islander children assessed as developmentally on track in all 5 domains of the Australian Early Development Census (AEDC) to 55 per cent
- Target 5: By 2031, increase the proportion of Aboriginal and Torres Strait Islander people (age 20–24) attaining Year 12 or equivalent qualification to 96 per cent
- Target 6: By 2031, increase the proportion of Aboriginal and Torres Strait Islander aged 25–34 years who have completed a tertiary qualification (Certificate III and above) to 70 per cent
- Target 7: By 2031, increase the proportion of Aboriginal and Torres Strait Islander youth (15–24 years) who are in employment, education or training to 67 per cent.
See Targets 4, 5, 6 and 7 in the Closing the Gap Information Repository.
NAPLAN is an annual assessment for students in Years 3, 5, 7 and 9 that includes tests in reading, writing, spelling, grammar and punctuation, and numeracy. In 2023, approximately one-third of First Nations students in each Year level (ranging from 29% to 35%) achieved Strong or Exceeding proficiency levels – indicating they met or exceeded challenging, but reasonable, expectations at the time of testing. Another third were assessed as having a ‘Developing’ proficiency levels, indicating they were working towards expectations at the time of testing (30% to 34%). Around one-third of First Nations students in each Year level (32% to 34%) had a result of ‘Needs Additional Support’ indicating that they were not achieving the learning outcomes expected at the time of testing and are likely to need additional support to progress satisfactorily.
Students’ NAPLAN performance varied largely by remoteness. On average, across all five learning areas, the proportion of students achieving Strong or Exceeding proficiency levels decreased as remoteness increased. In Major cities, a range of 35% to 42% of First Nations students across all year levels achieved these learning proficiency levels, whereas in Very remote areas, the range was much lower, from 6.8% to 9.3%.
Conversely, averaging the five learning areas, First Nations students in Major cities had a lower proportion needing additional academic support, ranging from 23% to 26% across the year levels. These percentages were significantly lower compared to those in Very Remote areas, where the range between 68% and 77%.
NAPLAN trend data are available for the decade from 2013 to 2022 (excluding 2020 when the NAPLAN was not conducted due to the COVID-19 pandemic). Using linear regression analysis to assess change over time for each testing domain and year level indicates that average scores largely remained similar over the decade, with the following exceptions:
- Among First Nations Year 3 students, the mean scale scores for reading and writing increased by 7.4% based on linear regression analysis for reading and 7.3% for writing.
- For Year 5 students, the mean scale scores increased by 4.4% in writing, 3.6% in spelling and 2.6% in numeracy.
- For Year 7 students, there were increases in mean scale scores for writing and spelling by 5.7% and 1.5%, respectively.
- For Year 9 students, there was a 1.1% decrease in the mean scale score for reading.
Between 2011 and 2021, rates of highest education or training level completed have also improved significantly. The proportion of First Nations young adults aged 20–24:
- who had completed Year 12 qualification or equivalent, or attained a non-school qualification at Certificate III level or above, increased from 52% to 68%
- who had completed a non-school qualification at Certificate III or above, and/or were currently studying for a non-school qualification at any level, increased from 35% to 48%. This was mainly due to increased attainment of certificate III or advanced diploma qualifications (Figure 5.3).
Figure 5.3: Attainment of post-school qualifications among Australians aged 20–64, as proportion of population, by Indigenous status, 2011 to 2021
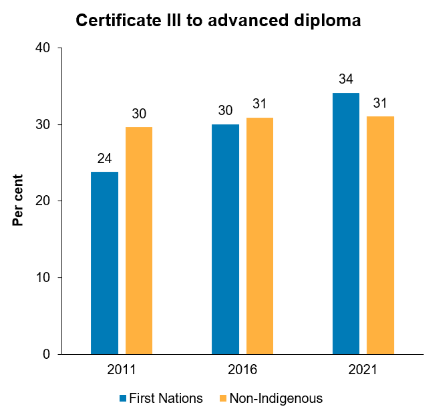
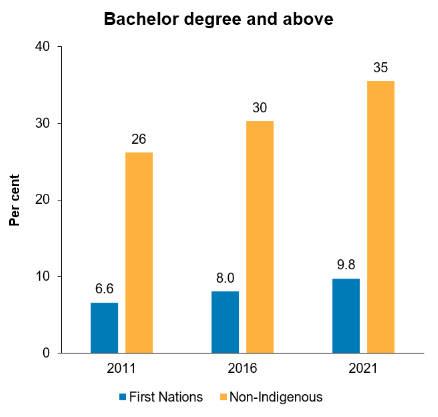
Source: Measure 2.06, Table D2.06.13. AIHW analysis of ABS Census of Population and Housing 2021 (AIHW 2022c).
Educational attainment for First Nations people was highest in Major cities. In 2021, the proportion of First Nations people aged 20–24:
- with a Year 12 or a non-school qualification (Certificate III level or above) was 76% (23,400 people) in Major cities, compared with 42% (2,500) in Very remote areas
- with a Certificate III to Advanced diploma was 37% (60,800 people) in Major cities, compared with 16% (6,100) in Very remote areas
- with a Bachelor Degree or above was 14% (22,800) in Major cities, compared with 2.2% (830) in Very remote areas.
Educational achievement for all students tends to decrease with increases in remoteness of usual residence, the disparity being more pronounced among First Nations students compared with non-Indigenous students.
For further information, see: