3. How First Nations people are faring
In 2018, the burden of disease among Aboriginal and Torres Strait Islander (First Nations) people was 2.3 times that of non-Indigenous Australians. The leading contributors to burden for First Nations people were, in order: mental and substance use disorders, injuries and chronic diseases such as cardiovascular disease, cancer, musculoskeletal conditions and respiratory disease. In general, people living in rural and remote areas are more likely to live with, and die prematurely from, a disease or injury (AIHW 2022a). People in remote areas also experience higher rates of potentially preventable hospitalisations and avoidable deaths. This is particularly relevant to First Nations people as the proportion of the First Nations people out of the total population increases with remoteness, from 2.2% in Major cities to 47.1% in Very remote areas (based on 2021 Census) (Table 2.1).
First Nations people have lower access to health services than non-Indigenous Australians, for a range of reasons including barriers such as cost and a lack of accessible or culturally appropriate health services. For First Nations people to have better health outcomes, improvements in the health system and determinants beyond the health sector are required. A large part of the disparity in health outcomes between First Nations people and non- Indigenous Australians is also explained by disparities in social determinants (in particular income, employment, housing and education) – accounting for an estimated 35% of the total health gap between First Nations people and non-Indigenous Australians in 2017–19 (AIHW 2024b).
Measures of First Nations people’s health status and outcomes drawn from the HPF show mixed results over the most recent decade of data. Some key changes in health outcomes, determinants of health, and health system performance are shown in figures 3.1, 3.2 and 3.3, respectively. A summary of the rate for First Nations people is shown, along with change in the gap between First Nations people and non-Indigenous Australians based on rate difference. The rate difference is the absolute difference between the rates for First Nations people and non-Indigenous Australians, calculated by subtraction. Another measure of the gap used across the HPF website (in addition to rate difference) is rate ratio. A rate ratio measures the relative difference in rates, calculated by dividing the rate for First Nations people by the rate for non-Indigenous Australians.
Note that changes over time cannot be assessed for all measures, as trend data are not available in all cases. When assessing change over time, information from all data points in the series has been considered, rather than just the first and last points in the time trend. Linear regression (based on ‘least squares’ method) was used when assessing change over time for all trends shown with more than 5 data points.
It is sometimes difficult to establish the reasons behind improving or worsening health in a population, for several reasons:
- The factors that affect health are complex and are often inter-related.
- The relationship between health and determinants of health can work in both directions – while education and employment can affect people’s health, health can also affect people’s ability to participate in schooling and work.
- Health is shaped throughout life – an adult’s health is shaped by their life history, daily living conditions and health behaviours (Osborne et al. 2013).
However, measures across the HPF tiers can provide insights into changing health outcomes. Many of the HPF measures are interrelated so that progress in in one produce benefits across a range of others. For example, reductions in smoking are associated with lower mortality from cardiovascular diseases and a range of cancers, and reducing smoking in pregnant women is associated with healthier birthweight and lower infant and perinatal mortality, indicating the benefits of increased efforts to reduce smoking and to identify and fill service gaps. Improvements in housing can have health, education, employment and other social and economic benefits.
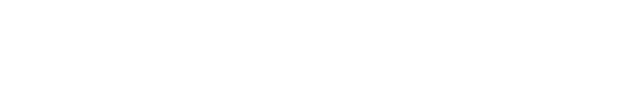
Figure 3.1: Key changes in health status and outcomes for First Nations people over time
Notes:
1. Infant and child mortality data are from New South Wales, Queensland, Western Australia, South Australia and the Northern Territory combined.
2. 'First Nations’ progress refers to whether there has been an improvement for the First Nations population. 'Rate difference' progress indicates whether the absolute difference in the measure between First Nations and non-Indigenous population has improved.
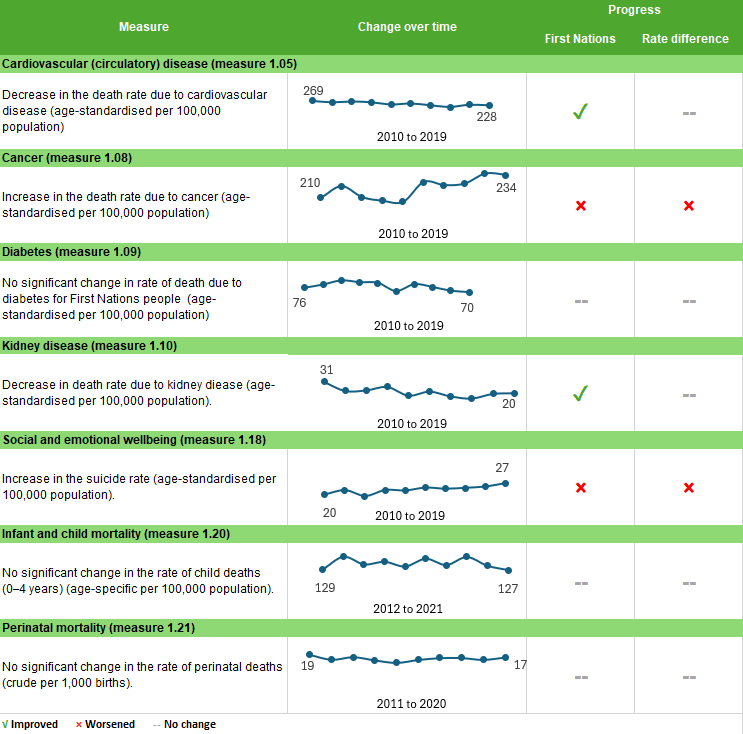
Figure 3.2: Key changes in determinants of health for First Nations people over time
Notes:
1. In the employment data, people who participated in CDEP and received wages from their community were considered as employed in the 2011 Census. This changed in 2016 where people who participated in the CDP received income support payments directly from the Government and were not considered to be employed, unless they had another non-CDP job. Also , in 2021, the Census was held on 10 August, during which most states and territories in Australia were under restrictions due to the COVID-19 pandemic. COVID-19 restrictions affected people’s labour force status, working hours, and attendance at their usual workplace. Complexities in interpretation of employment during lockdown may have also affected how people responded to questions about their labour force status.
2. 'First Nations’ progress refers to whether there has been an improvement for the First Nations population. 'Rate difference' progress indicates whether the absolute difference in the measure between First Nations and non-Indigenous population has improved.
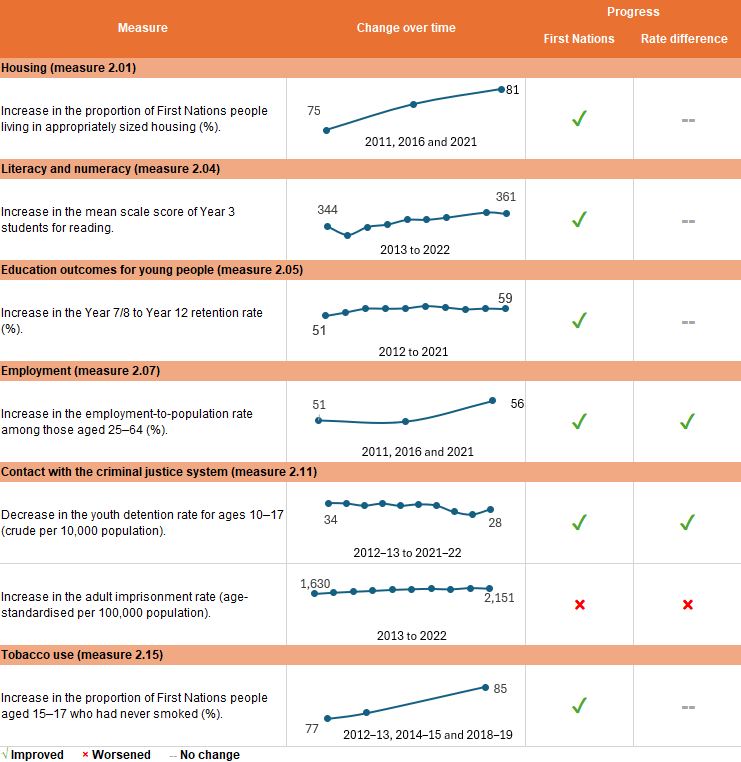
Figure 3.3: Key changes in health system performance for First Nations people over time
Note: 'First Nations’ progress refers to whether there has been an improvement for the First Nations population. 'Rate difference' progress indicates whether the absolute difference in the measure between First Nations and non-Indigenous population has improved.
Outcomes have improved for a number of measures
Over the period from 2013 to 2022 (excluding 2020 when the NAPLAN was not conducted due to the COVID-19 pandemic), the average scale scores for First Nations Year 3 students increased by 7.4% in reading and 7.3% in writing. Similarly, the average scale scores for First Nations Year 5 students increased by 4.4% in writing, 3.6% in spelling and 2.6% in numeracy. Additionally, Year 7 First Nations students showed an increase in average scale score by 5.7% in writing and 1.5% in spelling.
Levels of educational attainment have improved over the decade. Between 2011 and 2021, the proportion of First Nations people aged 20–24 who had completed Year 12 or equivalent increased from 52% to 68%, and the gap in attainment rates between First Nations people and non-Indigenous Australians aged 20–24 decreased from 34 to 23 percentage points. The relative difference (rate ratio) also decreased, from a Year 12 attainment rate that was 1.6 times as high for non-Indigenous Australians as First Nations people to one that was 1.3 times as high. In 2021, 48% of First Nations people aged 20–64 reported they either completed a non-school qualification at Certificate III or above or were studying for a non-school qualification at any level – an increase from 42% in 2016 and 35% in 2011.
Cardiovascular disease is the second leading cause of death among First Nations people. The age-standardised death rate due to cardiovascular disease decreased by 18% over the decade from 2010 to 2019 (though there was no significant change in the gap, due to a similar decrease in the rate for non-Indigenous Australians). The decline in deaths from cardiovascular disease coincided with reductions in smoking rates and an increase in the proportion of hospitalisations receiving a cardiovascular-related procedure among First Nations adults hospitalised for acute heart diseases.
Over the decade from 2010 to 2019, the age-standardised rate of death due to kidney disease declined by 36%.
Between 2012–13 and 2021–22, the rate of community-based supervision for First Nations young people (aged 10–17) declined from 147 to 94 per 10,000 population, a reduction of 34% based on linear regression.
In the decade from 2012–13 to 2021–22, the rate of First Nations young people aged 10–17 in detention declined from 34 to 28 per 10,000 population, while the rate for non-Indigenous young people remained the same, and the gap between First Nations and non-Indigenous young people declined (from 33 to 27 per 10,000). Based on linear regression, the rate of First Nations young people aged 10–17 in detention declined by 25% nationally during this period.
The proportion of First Nations households who owned their home increased slightly over the last three Censuses – from 37% in 2011, to 40% in 2016, and 42% in 2021. The proportion of First Nations people living in appropriately sized housing increased from 74.6% in 2011, to 78.9% in 2016, and 81.4% in 2021.
Between 2011 and 2021, the employment rate for First Nations people aged 15–64 also increased from 46% in 2011, to 47% in 2016, and 52% in 2021.
Median household incomes of First Nations people increased in real terms (that is, after adjusting for inflation) from $619 to $825 per week between 2011 and 2021. Non-Indigenous households experienced a weekly increase in income of $998 to $1,141 over the same period.
The proportion of First Nations people aged 15 and over who smoked daily fell from 45% in 2008 to 37% in 2018–19. The proportion of First Nations people aged 15–17 who smoked fell from 22% to 13% between 2008 and 2018–19 and the proportion who had never smoked increased from 72% to 85% over the same period. The age-standardised proportion of First Nations women who smoked during pregnancy fell from 48% in 2011 to 44% in 2020.
Between 2012 and 2020, the age-standardised proportion of First Nations mothers who gave birth at 20 weeks or more gestation and attended at least one antenatal care visit in the first trimester of pregnancy (before 14 weeks of gestation) increased from 51% in 2012 to 69% in 2020.
The rate of health assessments for First Nations people increased 4-fold between 2009–10 and 2018–19 from 68 checks per 1,000 population to 297 checks per 1,000.
Between 2010–2011 and 2018–2019, participation rates in BreastScreen Australia among First Nations women aged 40 and above increased from 18% to 27%, before decreasing to 25% in 2019–2020, most likely due to the impact of the COVID-19 pandemic.
Between 2009–10 and 2017–18, the age-standardised rate of Medicare Benefit Schedule (MBS) claims for First Nations people for chronic disease management plans increased – from 55 to 125 per 1,000 for Team Care Arrangements (TCAs) and from 69 to 142 per 1,000 for GP Management Plans (GPMPs). In 2017–18, the rate for TCAs and GPMPs combined was 1.4 times the rate for non-Indigenous Australians (267 per 1,000 compared with 185 per 1,000).
In 2018–19, 92% of First Nations people reported they had a usual place to go for health problems and advice. Those with a usual general practitioner or medical service reported higher rates of satisfaction with their health care experience than those without one.
The rate of general practitioner Medicare Items claimed by First Nations people increased by 42% between 2003–04 and 2017–18. First Nations people used GP services at rates that were slightly higher than those for non-Indigenous Australians (1.2 times) but do not reflect the higher level of need among First Nations people.
Over the decade from 2011–12 to 2020–21, based on linear regression, there was a 19% increase in the age-standardised proportion of hospitalisations for First Nations people that included a hospital procedure.
Over the decade from 2011–12 to 2020–21, based on linear regression, the age-standardised proportion of hospitalisations for First Nations people that ended in discharge at own risk (excluding dialysis) decreased from 4.6% to 3.8%. In contrast, there was little change in the proportion of emergency department presentations where the First Nations patient did not wait to be seen by a health care professional or left at own risk before completing treatment, from 9.1% in 2011–12 to 9.2% in 2020–21.
However, there has been little recent change for some measures
Over the decade from 2010 to 2019, the age-standardised rate of potentially avoidable deaths among First Nations people did not change significantly, nor was there a significant change in the absolute gap between First Nations people and non-Indigenous Australians.
From 2010 to 2019, there was no significant change in the age-standardised all-cause death rate for First Nations people. However, the rate for non-Indigenous Australians declined by 8.6% and as a result the gap widened by 18% over this period.
Between 2012 and 2021, there were no significant changes in the death rates of perinatal, neonatal or stillbirth babies born to First Nations mothers nor was there any significant reduction in the gap with babies born to non-Indigenous mothers. During the same period, there was no statistically significant change in the rate of deaths for First Nations children aged 0–4, nor any significant change in the gap.
In 2018–19, 31% of First Nations adults reported high/very high levels of psychological distress, not significantly different from 2014–15 (33%). Those who had been removed from families or had relatives removed from families had a higher proportion of high/very high levels of psychological distress (38%) compared with those who had not been removed nor had a family member removed (26%).
MBS claim rates for First Nations patients accessing specialist providers were almost one-half the rate of non-Indigenous patients (598 per 1,000 and 1,070 per 1,000 population, respectively) in 2017–18. Over the period from 2009–10 to 2017–18 there was no significant change in the age-standardised rate of Medicare claims for specialist care among First Nations people.
Some measures have worsened
Cancer is currently the leading cause of death for First Nations people (accounting for 23.4% of all deaths of First Nations people). Between 2010 and 2019, the death rate for First Nations people increased by 12% while the non-Indigenous Australians rate decreased by 10%. This resulted in a widening of the absolute gap between First Nations people and non-Indigenous Australians. First Nations people have lower cancer screening rates and are more likely to be diagnosed with cancer at more advanced stages resulting in lower cancer survival rates. Note that while there have been recent reductions in tobacco smoking, a risk factor for lung and other cancers, a time lag is expected before those improvements will result in measurable changes in cancer-related mortality.
In 2015–2019, the suicide rate for First Nations people was 24 per 100,000 deaths and accounted for 5.5% of all deaths among First Nations people. Over the decade from 2010 to 2019, the age-standardised rate of death due to suicide increased by 30% for First Nations people. Similarly, over the period from 2009–10 to 2018–19 the hospitalisation rate of First Nations people for intentional self-harm increased by 63%.
Over the decade from 2009–10 to 2018–19, the age-standardised rate of hospitalisations due to assault for First Nations people increased by 7.9%. This increase was driven by the 11% increase in hospitalisation rates due to assault for First Nations females as the rate for First Nations males remained unchanged over this period.
From 2013 to 2022, the age-standardised imprisonment rate among First Nations adults increased from 1,630 to 2,151 per 100,000 adults. Based on linear regression of data for all years in the decade, the age-standardised imprisonment rate for First Nations adults increased by 31%, with little change among non-Indigenous adults. The absolute gap (rate difference) between First Nations and non-Indigenous adults widened (from 1,497 to 2,000 per 100,000 adults), and the relative difference in imprisonment rate between First Nations and non-Indigenous adults increased from 12 times as high for First Nations people to 14 times as high (from a rate ratio of 12.2 to 14.3) over this period.