Leading causes of disease burden and mortality
Burden of disease
In 2018, Aboriginal and Torres Strait Islander (First Nations) people lost 239,942 years due to premature death or living with disease or injury, which equates to around 289 DALY for every 1,000 First Nations people. The rate of disease burden among First Nations people was more than double (2.3 times) that of non-Indigenous Australians in 2018. After adjusting for differences in population size and age structure:
- 400 years were lost to disease burden for every 1,000 First Nations people
- 177 years were lost to disease burden for every 1,000 non-Indigenous Australians.
Among First Nations people aged under 75, almost two-thirds (64%) of the fatal burden of disease was due to potentially avoidable deaths (AIHW 2022d).
Between 2003 and 2018, after adjusting for population growth and ageing, the total burden for First Nations people declined by 15%. The decrease was driven by a 27% decline in fatal burden. There was no substantial change in non-fatal burden over the same period.
These results come from Australian Burden of Disease Study: impact and causes of illness and death in Aboriginal and Torres Strait Islander people 2018 (AIHW 2022d), the latest available burden of disease information for First Nations people and non-Indigenous Australians.
Among First Nations people, 23% of total disease burden in 2018 was due to mental and substance use disorders (54,263 DALY). The other leading causes were:
- injuries (12% or 29,769)
- cardiovascular disease (10% or 24,612)
- cancer (9.9% or 23,742)
- musculoskeletal conditions (8.0% or 19,168) (Figure 4.5).
First Nations people in Very remote (492 DALY per 1,000 population) and Remote (486 DALY per 1,000 population) areas experienced higher rates of total burden than those living in Major cities (393 DALY per 1,000 population). The mental and substance use disorders disease group was the leading contributor to burden in all remoteness areas, ranging from 17% to 27% of total burden.
First Nations people living in the most socioeconomic disadvantaged areas experienced more than 3 times the total burden of First Nations people in the least socioeconomic disadvantaged areas (591 and 164 DALY per 1,000 population, respectively).
Figure 4.5: Leading causes of disease burden among First Nations people, by sex, 2018
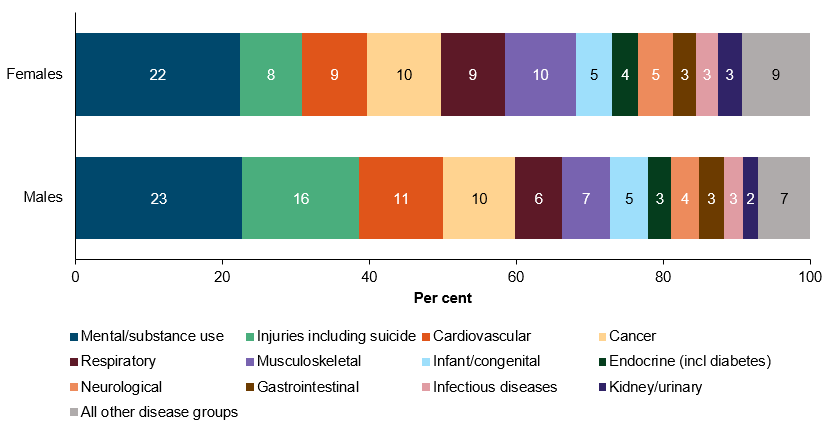
Source: adapted from Australian Burden of Disease Study: impact and causes of illness and death in Aboriginal and Torres Strait Islander people 2018 (AIHW 2022d).
For further information, see:
Avoidable deaths
Over the 5-year period 2015–2019, there were 7,366 potentially avoidable deaths among First Nations people, accounting for 60% of all deaths of First Nations people aged 0–74 (data from New South Wales, Queensland, Western Australia, South Australia, and the Northern Territory combined). The rate of potentially avoidable deaths among First Nations people was 208 deaths per 100,000 population, with a higher rate in more remote areas, ranging from 142 deaths per 100,000 population in Major cities to 329 deaths per 100,000 population in Remote and very remote areas.
Between 2010 and 2019, there was no significant change in the rate of potentially avoidable deaths for First Nations people. In comparison, the rate decreased by 13% for non-Indigenous Australians. Over the same decade, there was no significant change in the gap (rate difference) in the rate of potentially avoidable deaths between First Nations people and non-Indigenous Australians (Figure 4.6). The relative difference in rates between First Nations people and non-Indigenous Australians (rate ratio) ranged between 2.8 in 2011 and 3.3 in 2019.
Figure 4.6: Potentially avoidable deaths by Indigenous status (age-standardised rate) (2010–2019), and by remoteness for First Nations people (crude rate) (2015–2019)
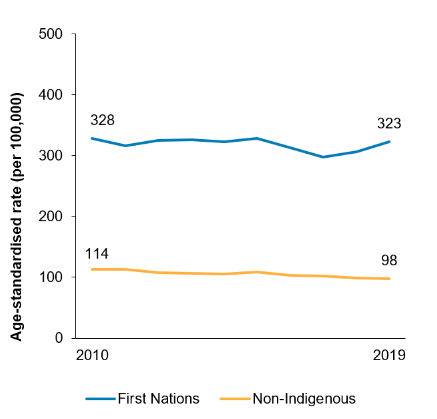
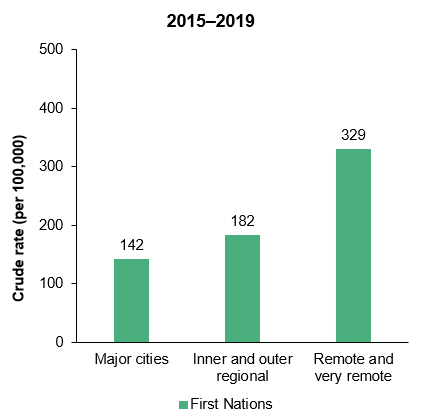
Note: Data from New South Wales, Queensland, Western Australia, South Australia, and the Northern Territory combined.
Source: Measure 1.24, Table D1.24.2 and Table D1.24.6 – AIHW National Mortality Database.
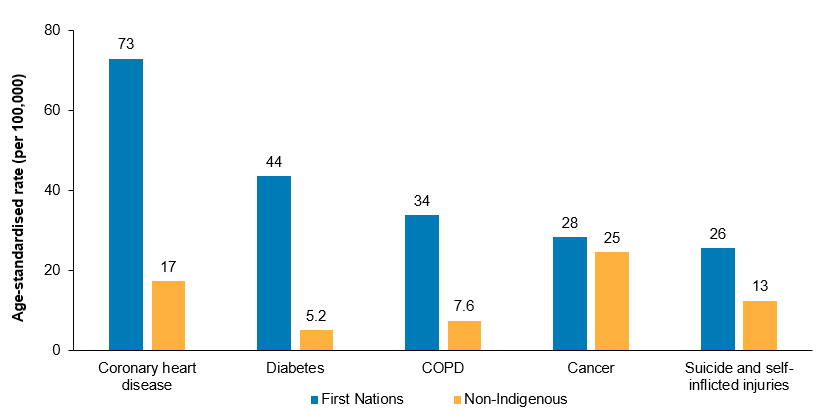
In 2015–2019, the leading 5 causes of potentially avoidable deaths among First Nations people were:
- coronary heart disease (21.0%, 1,560 deaths)
- diabetes (12.0%, 868 deaths)
- suicide and self-inflicted injuries (11.0%, 843 deaths)
- chronic obstructive pulmonary disease (8.8%, 651 deaths)
- cancer (8.0%, 587 deaths).
The age-standardised rates of potentially avoidable deaths due to these five leading causes were consistently higher for First Nations people than for non-Indigenous Australians (Figure 4.7). The conditions contributing most to the gap in rates of potentially avoidable deaths between First Nations people and non-Indigenous Australians were coronary heart disease (26% of the gap in avoidable deaths), diabetes (18% of the gap) and chronic obstructive pulmonary disease (13% of the gap).
Figure 4.7: Rate of potentially avoidable deaths, top 5 causes, by Indigenous status, 2015–2019 (age-standardised)
Notes
1. Data from New South Wales, Queensland, Western Australia, South Australia, and the Northern Territory combined.
2. Data are shown for the top 5 causes of avoidable death for First Nations people.
Source: Measure 1.24, Table D1.24.5 – AIHW and ABS analysis of National Hospital Mortality Database.
For further information, see:
Mortality rates and leading causes of death
In the 5-year period 2015–2019, there were 15,439 deaths of First Nations people, corresponding to 430 deaths per 100,000 population. Between 2010 and 2019, there was no significant reduction in the age-standardised death rate among First Nations people.
In 2015–2019, cancer and other neoplasms was the leading broad cause of death among First Nations people, accounting for 23% (3,612 deaths) of all deaths in this period. Cancer (as a broad disease group) was closely followed by cardiovascular disease (23.0%, 3,471 deaths), injury and poisoning (15.0%, 2,240 deaths), respiratory disease (9.7%, 1,498 deaths), and endocrine, nutritional and metabolic diseases (8.6%, 1,333 deaths) as the leading broad causes of death for First Nations people.
Death rates for First Nations males were higher than for First Nations females across most leading causes (except for kidney diseases (6.5 compared with 9.1 deaths per 100,000 population) and diabetes (29 compared with 34 deaths per 100,000)), where rates were higher for First Nations females. Death rates from all the leading causes of death were higher for First Nations people in remote areas than in non-remote areas.
The age-standardised death rate due to endocrine, nutritional and metabolic diseases for First Nations people was 3.7 times as high as for non-Indigenous Australians (86 compared with 23 deaths per 100,000 population).
For deaths caused by both injury and poisoning, and respiratory disease, death rates were twice as high for First Nations people compared with non-Indigenous Australians (79 compared with 40 deaths per 100,000 population; and 106 compared with 52 deaths per 100,000 population, respectively).
For chronic obstructive pulmonary disease, the age-standardised death rate for First Nations people was almost 3 times as high as for non-Indigenous Australians (69 compared with 25 deaths per 100,000 population).
For further information, see:
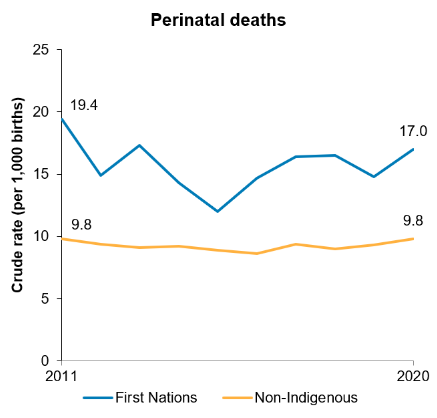
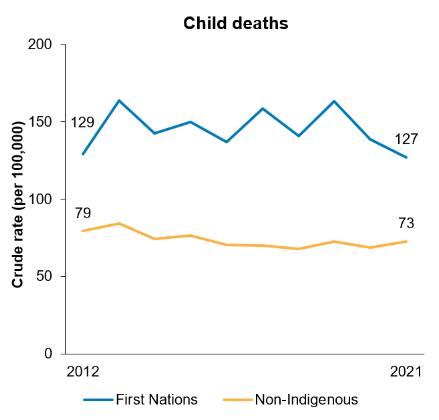
Perinatal, infant, and child mortality
Perinatal deaths include stillbirths (deaths prior to or during labour and/or birth) and neonatal deaths (within 28 days following birth).
Over the decade from 2011 to 2020, there was no significant change in the rate of perinatal deaths for babies born to First Nations mothers. There was no significant change in the rate of stillbirths (varying between 8.3 deaths and 13.3 deaths) or neonatal deaths (varying between 3.7 and 6.5 deaths per 1,000 live births) (Figure 4.8). There was also no statistically significant change in the perinatal death rate for babies born to non-Indigenous mothers, nor in the gap between the rates for First Nations and non-Indigenous mothers.
In New South Wales, Queensland, Western Australia, South Australia and the Northern Territory combined, the death rates of First Nations infants (aged under 1) did not change significantly from 2012 to 2021, which varied between 4.3 and 6.8 deaths per 1,000 livebirths. The death rate among First Nations children (aged 0–4) did not change significantly, ranging between 127 and 164 deaths per 100,000 children (Figure 4.8).
Figure 4.8: Rate of perinatal (2011–2020) and child deaths (2012–2021), by Indigenous status
Notes
1. Perinatal death is based on the Indigenous status of the mother.
2. Child deaths data New South Wales, Queensland, Western Australia, South Australia, and the Northern Territory combined. Child deaths include children aged 0–4.
Source: Measure 1.21, Table D1.21.2 – AIHW analysis of the National Perinatal Data collection; and Measure 1.20, Table D1.20.3 – AIHW National Mortality Database.
Note that data pertaining to perinatal deaths are from the AIHW’s National Perinatal Mortality Data Collection (NPMDC). These data points are sourced from midwives and other birth attendants, who collect information from mothers, perinatal administrative and clinical record systems. This differs to the source used for reporting on infant and child deaths (the National Mortality Database), which is based on death registrations. The 2 collections are not directly comparable.
For further information, see: