
Key messages
- The links between socioeconomic circumstances, structural disadvantage and intergenerational experiences of colonialism and racism are well established and documented. Research has shown that socioeconomic status can explain a large part of the gap in self-assessed health status between Aboriginal and Torres Strait Islander (First Nations) people and non-Indigenous Australians, as well as contributing to a significant part of the gap in life expectancy.
- A socioeconomic index is a way to measure how advantaged or disadvantaged a community or group of people is. It is a composite measure which takes into account a number of economic and social indicators – including income, employment, education and housing – that affect a person’s level of advantage or disadvantage.
- It is important to note that area-based socioeconomic indexes can be at risk of the ecological fallacy. The socioeconomic status of an area as a whole will not always reflect the socioeconomic status of its First Nations residents – not all First Nations people living in the least disadvantaged areas are in fact the least disadvantaged. This highlights the importance of examining variations within these areas to help target efforts to the populations in need.
- Indexes specific to the First Nations population reveal greater advantage in cities and regional areas than in remote areas, while whole-population indexes reveal First Nations people were over-represented in the lowest socioeconomic areas nationally in 2021, and under-represented in the other areas.
- In 2021, 30% of First Nations people lived in areas ranked in the most disadvantaged decile (the lowest ranked 10% of areas) based on the Index of Relative Socio-economic Advantage and Disadvantage (IRSAD), compared with fewer than 1 in 10 (8%) non-Indigenous Australians. In contrast, 2% of the First Nations population lived in the most advantaged decile, compared with 11% of non-Indigenous Australians.
- Across states and territories, the difference in the proportion of First Nations people and non-Indigenous Australians in the most disadvantaged quintile was smallest in the Australian Capital Territory (0.3 percentage points higher for First Nations people – 0.5% compared with 0.2%) and largest in the Northern Territory (60 percentage points higher for First Nations people – 68% compared with 8%). In the other six jurisdictions, the difference ranged between 18 and 30 percentage points.
- Between 2016 and 2021, there was a 2.4 percentage point reduction in the proportion of First Nations people living in the most disadvantaged quintile of areas nationally (48.0% compared with 45.6%), with the largest reduction in New South Wales (3.7 percentage points). However, this may be due to a range of factors including internal migration and increases in the number of people living in more advantaged areas who identify as being of Aboriginal and/or Torres Strait Islander origin in the 2021 Census, rather than any true change in socioeconomic outcomes.
- Between the 2016 and 2021 Census, 43.5% of the change in the counts of First Nations people was demographic – comprising births, deaths and migration – while the remaining 56.5% was non-demographic. This means comparing the socioeconomic outcomes of First Nations people between 2021 and 2016 is complicated by the changing composition of the latter group.
- It is estimated that in the Northern Territory, socioeconomic status contributes between 25% and 30% of the health disparity between First Nations people and non-Indigenous Australians, encompassing both quality of life and life expectancy.
- Access to primary health-care services and appropriately trained health professionals can reduce the disparities among the socioeconomically disadvantaged populations.
- Reducing health inequalities requires ensuring fairness and equity within society, not merely focusing on economic growth or wealth accumulation, but ensuring all individuals have equitable opportunities to lead healthy lives.
Why is it important?
Evidence indicates a close relationship between people’s health and their living and working conditions, collectively known as the social determinants of health, which include factors such as socioeconomic position, educational attainment, employment conditions, wealth distribution, empowerment and social support. According to the World Health Organization (WHO), health inequities are the unfair and avoidable differences in health status seen within and between populations. There are two main clusters of root causes to health inequity. The first cluster includes intrapersonal, interpersonal, institutional and systemic mechanisms that distribute power and resources unequally across lines of race, gender, class, sexual orientation, gender expression and other aspects of identity. The second, more fundamental cause is the unequal distribution of power and resources – such as goods, services and societal attention – which creates unequal social, economic and environmental conditions (AIHW 2024c; Baciu et al. 2017).
Across many nations – including Australia – health and illness follow a social gradient: the lower the socioeconomic position, the worse the health outcomes. Social determinants are part of the wider determinants of health, which also include environmental, cultural, biomedical, commercial and digital factors (AIHW 2024c). The cultural determinants are anchored in Aboriginal and Torres Strait Islander (First Nations) ways of knowing, being and doing that encompass a holistic understanding of health and wellbeing. Culture is central to this understanding and shapes the relationship between self to Country, kin, community and spirituality— all of which are key factors of health and wellbeing. This notion extends to a First Nations focus on life-giving values from which individuals, families and communities can draw strength, resilience and empowerment (Verbunt et al. 2021; Williamson et al. 2020). Studies have linked social inclusion and close bonds outside the family to lower morbidity and increased life expectancy, with strong social networks benefiting physical and mental health through practical and emotional support. Conversely, social exclusion, characterised by disadvantage and lack of resources, can cause psychological damage and harm health through long-term stress and anxiety (AIHW 2024c).
For many First Nations people, their culture, community and history play a fundamental part in their health and wellbeing. As Professor Ngiare Brown stated:
The association between socioeconomic disadvantage and health is a key component in understanding health disparities between First Nations people and non-Indigenous Australians. While improvements in economic conditions are likely to enhance health outcomes, health disparities will persist unless other factors, such as cultural, system and historical factors are addressed (Booth & Carroll 2008). First Nations people living in areas with the most socioeconomic disadvantage experience a significantly higher burden of disease. A gradient of increasing burden with increasing socioeconomic disadvantage is associated with most disease groups (Adler & Stewart 2010; AIHW 2016; Hill-Briggs et al. 2020).
That said, having good socioeconomic circumstances does not necessarily mean that an individual’s health and other circumstances are good.
Therefore, socioeconomic indexes do not tell the whole story, but they can be a useful way to measure and track progress, by bringing together a range of factors that make up socioeconomic advantage and disadvantage.
Recognising the socioeconomic disparities between communities, the National Agreement on the Closing the Gap (the National Agreement) sets out seventeen socioeconomic outcome areas, each with a specific and measurable target. The National Agreement was developed in partnership between Australian governments and the Coalition of Aboriginal and Torres Strait Islander Peak Organisations. The National Agreement has been built around four Priority Reforms that have been directly informed by First Nations people. These reforms are central to the National Agreement and will change the way governments work with First Nations people, including through working in partnership and sharing decision making, building the Aboriginal community-controlled sector, transforming government organisations, and improving and sharing access to data and information to enable informed decision making by First Nations communities.
For the latest data on the Closing the Gap targets, see the Closing the Gap Information Repository.
Data findings
This measure primarily presents information based on the Indigenous Relative Socioeconomic Outcomes (IRSEO) index. Some information is also provided based on the Socio-Economic Indexes for Areas (SEIFA).
Starting with the 2001 Census, the Centre for Aboriginal Economic Policy Research (CAEPR) developed the IRSEO index. This index was created specifically for the First Nations population, using data from the ABS Census of Population and Housing from 9 questions on employment, occupation, education, income and housing (Biddle & Markham 2023) (see also Box 2.09.1).
SEIFA is the most frequently used measure of socioeconomic wellbeing of Australians, and is developed by the Australian Bureau of Statistics (ABS) (ABS 2021a). It is a collection of four different indexes, that each focus on a different concept of relative socioeconomic wellbeing. The indexes are derived using Census data for the total population (rather than First Nations respondents like with the IRSEO).
Note that the SEIFA and IRSEO indexes are all composite measures of the socioeconomic characteristics of an area. Within any area there will be households, families and individuals with different characteristics to the overall population of that area.
Socioeconomic distribution based on First Nations-specific index
In 2021, socioeconomic scores were produced for 401 Indigenous Areas based on the IRSEO index (Biddle & Markham 2023). The score reflects the level of relative socioeconomic advantage or disadvantage experienced by First Nations people living in each Indigenous Area. Based on these scores, Indigenous Areas are ranked and allocated to percentiles between 1 and 100, where 1 represents the most advantaged area and 100 represents the most disadvantaged area.
For the analysis in this measure, Indigenous Areas have been organised into 5 equal groups called quintiles. Each quintile represents around 20% of the total Indigenous Areas and is sorted by their IRSEO scores. Quintiles range from:
- Quintile 1: This is the group with the highest level of disadvantage, making up the bottom 20%. It contains 81 Indigenous Areas.
- Quintiles 2 to 4: These middle groups each have 80 Indigenous Areas.
- Quintile 5: This is the most advantaged group, in the top 20%. It contains 80 Indigenous Areas.
The quintiles help us compare areas based on their socio-economic status, from the most to the least disadvantaged.
In 2021, nearly one-quarter (23%) of the First Nations population lived in the most advantaged Indigenous Areas (Quintile 5), and a further 27% in the next most advantaged areas (Quintile 4). About 9% lived in the most disadvantaged areas (Quintile 1), with a further 14% in the next most disadvantaged areas (Quintile 2) (Table 2.09-1). This reflects that the more disadvantaged Indigenous Areas tend to be those with smaller populations.
The 5 most advantaged Indigenous Areas in 2021 were: Sydney – Lower North (NSW), Woollahra – Waverley (NSW), Melbourne – East (Vic), Northern Beaches (NSW), and Hornsby – Ku-ring-gai (NSW).
The 5 most disadvantaged Indigenous Areas, all within the Northern Territory, were: Lajamanu, followed by Walungurru and Outstations, Ampilatwatja and Outstations, Wutunugurra - Canteen Creek, and Haasts Bluff - Mount Liebig (Watiyawanu) (AIHW analysis of Biddle & Markham 2023).
Note that these data relate only to the First Nations population. They do not reflect socioeconomic advantage or disadvantage for the Australian population generally, and do not provide a comparison to non-Indigenous Australians.
Table 2.09-1: First Nations population distribution, by socioeconomic area (IRSEO quintile), Census night 2021
|
IRSEO quintile |
Number |
Per cent |
|---|---|---|
| Quintile 1 (most disadvantaged areas) | 71,877 | 9.2 |
|
Quintile 2 |
111,212 | 14.2 |
| Quintile 3 | 213,868 | 27.3 |
| Quintile 4 | 208,435 | 26.7 |
| Quintile 5 (most advantaged areas) | 176,668 | 22.6 |
| Total | 782,061 | 100 |
| Not applicable (number) | 30,665 |
. . |
Note: Data are based on Census counts, and so are an under-count of the total First Nations population.
Source: Table D2.09.4, AIHW analysis of Census of Population and Housing (ABS 2022) and Indigenous Relative Socioeconomic Outcomes (IRSEO) index (Biddle & Markham 2023).
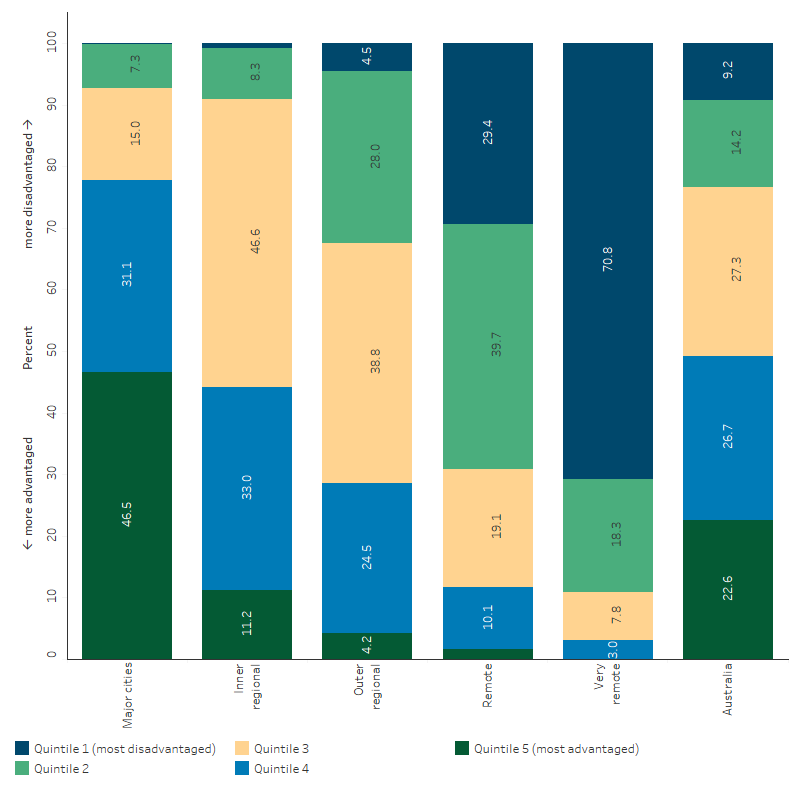
First Nations people living in non-remote areas experienced greater area-level advantage than those in remote areas (Figure 2.09.1, Table D2.09.4). The ABS remoteness structure used in this analysis is constructed by calculating relative geographic access to services via road. The relationship between socioeconomic disadvantage and remoteness will therefore reflect, in large part, the disparity in access to services in more remote areas.
On Census night in 2021, nearly half (47%) of First Nations people living in Major cities were in the most advantaged quintile of Indigenous Areas, compared with 11% in Inner regional areas, 4.2% in Outer regional areas, 1.6% in Remote areas, and less than 1% in Very remote areas. Among First Nations people living in Very remote areas, 71% were in an Indigenous Area classified in the most disadvantaged quintile, compared with 29% in Remote areas, 5% in Outer regional areas, 1% in Inner regional areas, and none in Major cities (Figure 2.09.1).
In general, Indigenous Areas in urban areas tended to be relatively more advantaged, and those in remote areas tended to be relatively more disadvantaged. However, there were exceptions to this general pattern. For example, in 2021:
- There were 4 Indigenous Areas that ranked in the second most disadvantaged quintile of Indigenous Areas, indicating relative disadvantage, despite being city areas: Blacktown (in New South Wales), Playford (South Australia), Gosnells (Western Australia), and Fairfield (New South Wales).
-
The following 7 Indigenous Areas were in the second most advantaged quintile of areas nationally despite being in remote locations: Bogan (in New South Wales); Karratha (Western Australia); Exmouth – Ashburton (Western Australia); Flinders – Richmond – Dalrymple (Queensland); Barcaldine – Blackall – Longreach (Queensland); Cobar – Murrin Bridge (in New South Wales), Eyre (in Victoria) (AIHW analysis of Biddle & Markham 2023).
Figure 2.09.1: First Nations population distribution, by remoteness and socioeconomic area (IRSEO quintiles), 2021
Source: Table D2.09.4, AIHW analysis of Census of Population and Housing (ABS 2022) and Indigenous Relative Socioeconomic Outcomes (IRSEO) index (Biddle & Markham 2023).
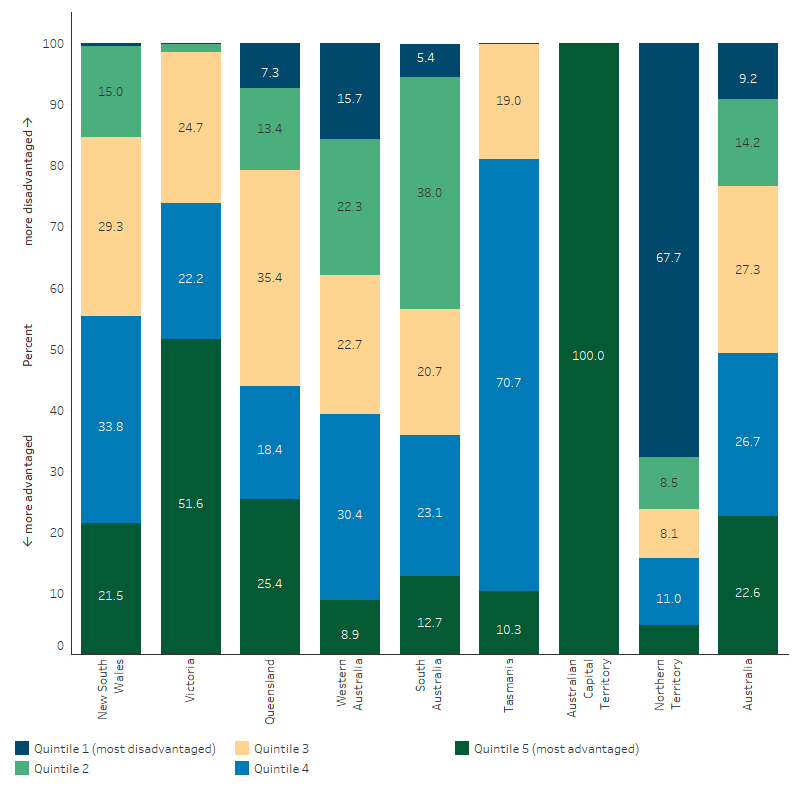
The number of Indigenous Areas by state and territory that received IRSEO scores in 2021 was as follows: New South Wales, 104 areas; Victoria, 39 areas; Queensland, 84 areas; Western Australia, 68 areas; South Australia, 33 areas; Tasmania, 11 areas; Australian Capital Territory, 3 areas; and the Northern Territory, 60 areas. Some Indigenous Areas were excluded due to small numbers (see also Box 2.09.1).
In 2021, all Indigenous Areas included in the analysis for the Australian Capital Territory scored in most advantaged quintile of Indigenous Areas nationally (top 20%), based on the IRSEO quintiles. Therefore, when looking at population distribution by socioeconomic group, 100% of the First Nations population in the Australian Capital Territory was living in the most advantaged quintile of Indigenous Areas nationally.
The First Nations population in Victoria also lived in relatively more advantaged areas compared with First Nations people in other jurisdictions, with 52% living in Indigenous Areas assessed as being in the most advantaged quintile of Indigenous Areas nationally.
In contrast, in the Northern Territory and Western Australia, less than 10% of the First Nations population lived in the most advantaged quintile of Indigenous Areas (Figure 2.09.2, Table D2.09.4).
First Nations people living in the Northern Territory experienced the greatest area-level disadvantage, with nearly 7 in 10 (68%) living in the most disadvantaged quintile of Indigenous Areas nationally. In other jurisdictions this proportion was 16% or less.
Figure 2.09.2: First Nations population distribution, by state/territory and socioeconomic area (IRSEO quintiles), 2021
Source: Table D2.09.4, AIHW analysis of Census of Population and Housing (ABS 2022) and Indigenous Relative Socioeconomic Outcomes (IRSEO) index (Biddle & Markham 2023).
Socioeconomic distribution based on total population indexes (SEIFA)
The ABS SEIFA is a collection of four different indexes, with each index focusing on a different concept of relative socioeconomic wellbeing:
- advantage and disadvantage (Index of Relative Socio-economic Advantage and Disadvantage; IRSAD)
- disadvantage (Index of Relative Socio-economic Disadvantage; IRSD)
- education and occupation (Index of Education and Occupation; IEO)
- economic resources (Index of Economic Resources; IER) (see Box 2.09.2).
The indexes are constructed using data from the ABS Census of Population and Housing. The population is broken down into small groups known as Statistical Area Level 1s (SA1) and assigned a score, allowing them to be ranked from most disadvantaged to most advantaged. There are 61,845 SA1 regions, with an average population of about 400 people.
Note that the SEIFA indexes are based on socioeconomic characteristics of the total population. These results should therefore be interpreted carefully. First Nations residents often represent a small proportion of an area’s total population, and therefore the socioeconomic status of that area as a whole will not always reflect the socioeconomic status of its First Nations residents (the ‘ecological fallacy’). One study found that First Nations people consistently had a lower socioeconomic status than the SEIFA score for their area (Kennedy & Firman 2004).
For the analysis in this measure, SA1s have been grouped into deciles (10 groups, tenths) and quintiles (5 groups, fifths) based on ranks for each index – that is, each decile contains 10% of SA1s, and each quintile contains 20% of SA1s.
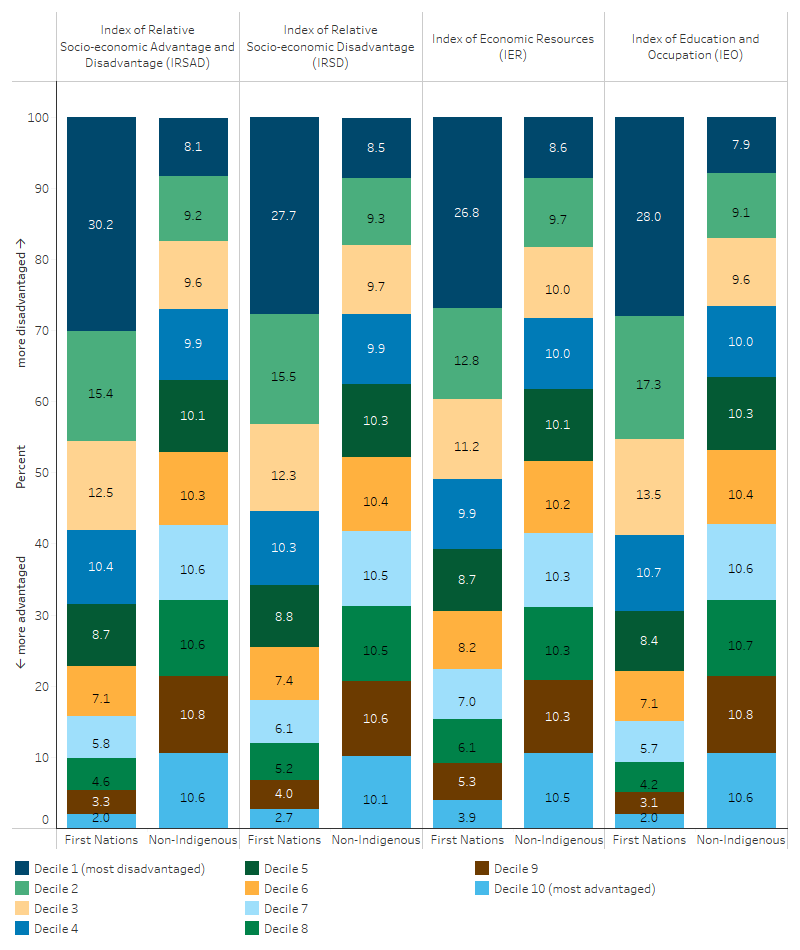
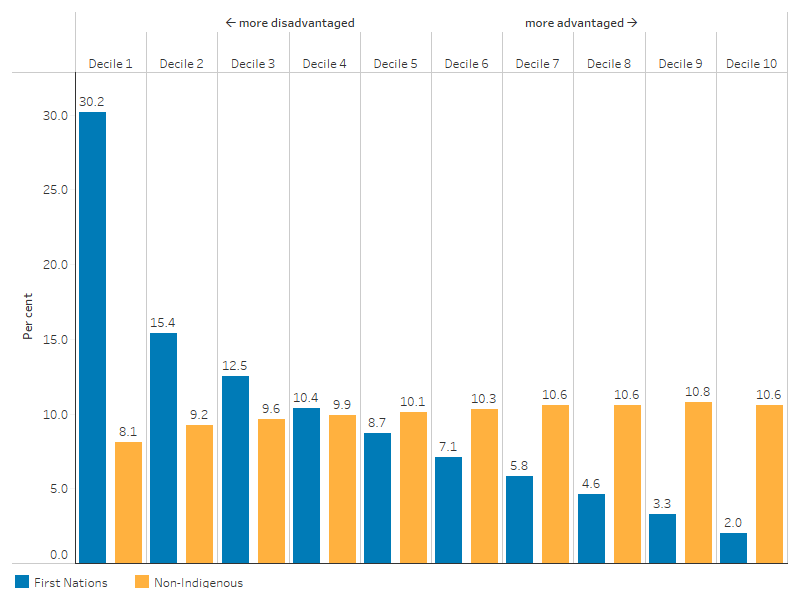
The distribution of the First Nations population by all four indexes is shown in Figure 2.09.3. The results are broadly similar across all indexes. Across all four indexes, the proportion of First Nations people living in areas ranked in the most disadvantaged 10% of SA1s (bottom decile) ranged between 26.8% and 30.2%, and the proportion in the most advantaged 10% (top decile) ranged between 2.0% and 3.9% (Table D2.09.1, Figure 2.09.3). The IRSAD is used in subsequent analysis, as it is a general-purpose index that measures both advantage and disadvantage.
Figure 2.09.3: Population distribution by socioeconomic area (SEIFA indexes), and Indigenous status, 2021
Source: Table D2.09.1, AIHW analysis of Census of Population and Housing (ABS 2022).
Based on the IRSAD index across states and territories in 2021, the Australian Capital Territory had the highest proportion of First Nations people (37%) who lived in areas in the most advantaged quintile of areas, and the lowest was in Tasmania (0.9%) (Table D2.09.2). The proportion of First Nations people living in areas in the most disadvantaged quintile was 0.5% in the Australian Capital Territory. Across other jurisdictions, it ranged between 32% in Victoria and 68% in the Northern Territory.
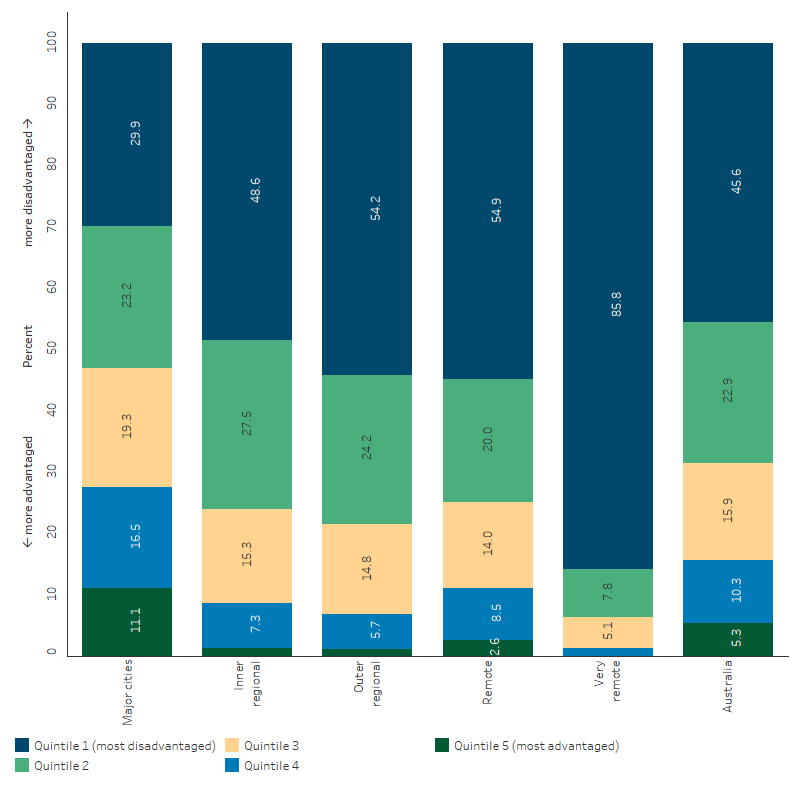
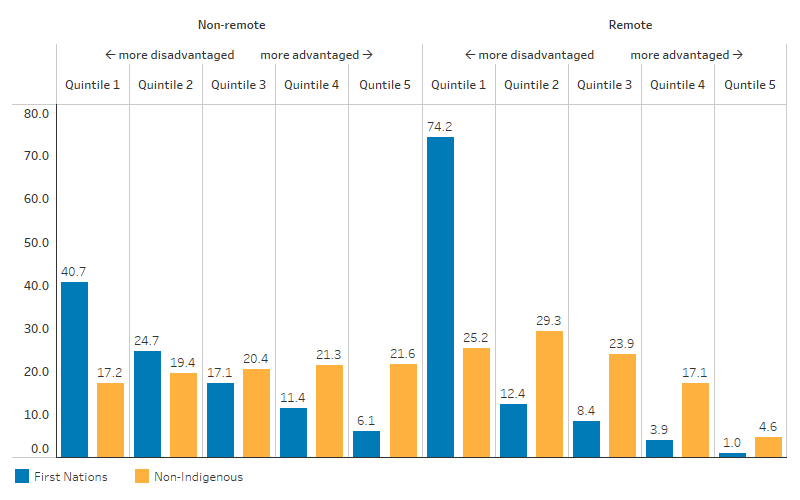
Across remoteness areas, based on the IRSAD index, the proportion of First Nations people who lived in the most advantaged quintile in 2021 was highest in Major cities (11%), and lowest in Very remote areas (0.1%). Conversely, the proportion of First Nations people who lived in the most disadvantaged quintile was lowest in Major cities (30%) and highest in Very remote areas (86%) (Figure 2.09.4, Table D2.09.3).
Figure 2.09.4: First Nations population distribution, by remoteness and socioeconomic area (SEIFA IRSAD quintiles), 2021
Source: Table 2.09.3 AIHW analysis of Census of Population and Housing (ABS 2022).
Burden of disease by socioeconomic area
Every year in Australia, many years of healthy life are lost because of injury, illness or premature deaths in the population. This loss of healthy life is called the ‘burden of disease’. Burden of disease is measured by disability-adjusted life years (DALY), which quantify the impact of living with and dying prematurely from a disease or injury. The higher the DALY number for a community, the more years of healthy life are lost due to illness, disability, or early death.
The AIHW has produced burden of disease estimates by socioeconomic group (using the IRSEO index) (see AIHW 2022). Based on these estimates, in 2018, burden of disease rates were highest in areas where the First Nations population was most socioeconomically disadvantaged, and fell with decreasing level of disadvantage (Figure 2.09.5).
Figure 2.09.5: Rates of disease burden (DALY) experienced by First Nations people by socioeconomic area (IRSEO), 2018
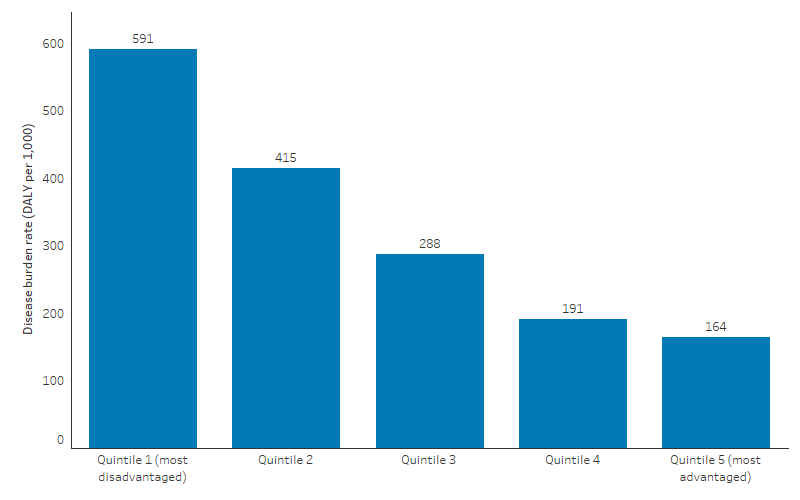
Source: AIHW Burden of Disease Database, as published in AIHW 2022.
Comparisons by Indigenous status
As IRSEO is an Indigenous-specific index, it cannot be used for comparisons with the non-Indigenous population. For comparison of socioeconomic distribution by Indigenous status, however, a Pooled Indigenous and Non-Indigenous Relative Socioeconomic Outcomes (PINIRSEO) index, created by Biddle & Markham 2023, can be used. This index ranks Indigenous Areas in two ways – one based on characteristics of the First Nations population, and the other based on characteristics of the non-Indigenous population. This means that each Indigenous Area is allocated two percentile ranks – one for the First Nations population and one for the non-Indigenous population.
Based on the PINIRSEO index, First Nations people were found to have greater levels of disadvantage than the non-Indigenous population in every area. For the First Nations population the average percentile rank across areas was 72.8, while for non-Indigenous Australians the average was 28.2. Therefore, the average gap between the socioeconomic characteristics of the First Nations population within an area and the non-Indigenous population was 44.6 percentile points with those in remote areas having larger gaps (Biddle & Markham 2023).
The ABS SEIFA indexes similarly indicate that First Nations people experience greater levels of area-level disadvantage than non-Indigenous Australians. In 2021, a larger proportion of First Nations people lived in areas ranked lower (more disadvantaged) on the IRSAD than in areas that ranked higher on the IRSAD. Note that IRSAD scores for each geographical area are calculated based on the socioeconomic characteristics of the entire population in that area (see also Box 2.09.2).
In 2021, 30% of First Nations people lived in the bottom 10% of areas while only 8% of non-Indigenous Australians lived in these areas. When looking at the top 10%, only 2% of First Nations people lived in the most advantaged decile compared with 11% of non-Indigenous Australians (Table D2.09.2, Figure 2.09.6).
Figure 2.09.6: Population distribution by socioeconomic area (SEIFA IRSAD), and Indigenous status, 2021
Source: Table D2.09.1. AIHW analysis of Census of Population and Housing (ABS 2022).
Data were aggregated to quintiles for more detailed analysis. In 2021, 46% of First Nations people nationally lived in the most disadvantaged quintile based on IRSAD, compared with 17% of non-Indigenous Australians – a difference of 28 percentage points (Figure 2.09.7, Table D2.09.2).
Across states and territories, the difference in the proportion of First Nations people and non-Indigenous Australians in the most disadvantaged quintile was smallest in the Australian Capital Territory (0.3 percentage points higher for First Nations people – 0.5% compared with 0.2%) and largest in the Northern Territory (60 percentage points higher for First Nations people – 68% compared with 8%). In the other six jurisdictions, the difference ranged between 18 and 30 percentage points.
In both remote and non-remote areas, a higher proportion of the First Nations population lived in the most disadvantaged quintile compared with non-Indigenous Australians, however the gap was larger in remote areas (Figure 2.09.7, Table D2.09.3). For the non-remote population, 41% of the First Nations population lived in the most disadvantaged quintile of areas nationally, compared with 17% of the non-Indigenous population – a difference of 23 percentage points. For the remote population, this difference was 49 percentage points, with 74% of the First Nations population living in the most disadvantaged quintile of areas nationally, compared with 25% of the non-Indigenous population.
Figure 2.09.7: Population distribution by socioeconomic area (SEIFA IRSAD), by remoteness and Indigenous status, 2021
Source: Table D2.09.3. AIHW analysis of Census of Population and Housing (ABS 2022).
Change over time
It is difficult to compare outcomes based on socioeconomic indexes over time for a number of reasons, including:
- the scores are relative rather than absolute measures of socioeconomic disadvantage. For example, if all areas became less disadvantaged over time, this would not be apparent in the results
- there are some changes in the boundaries of geographic areas between Censuses (ABS 2008).
In addition, there has been an increase in the number of people identifying as First Nations people over the last few Censuses, beyond what can be explained by population growth (ABS 2021b) (see also Box 2.09.3).
The analysis in this section should be considered with these caveats in mind.
Based on the total (First Nations and non-Indigenous) population based IRSAD index, between 2016 and 2021, there was a 2.4 percentage point reduction in the proportion of First Nations people living in the most disadvantaged quintile of areas nationally (48.0% compared with 45.6%). Decreases in the percentage of First Nations people in the most disadvantaged quintile of areas based on the IRSAD were observed in all jurisdictions, with the largest reduction in New South Wales (3.7 percentage points). The proportion of First Nations people living in the middle 60% of areas (quintiles 2-4) increased between 2016 and 2021, with no change in the proportion living in the most advantaged quintile of areas (AIHW analysis of ABS 2016, 2022).
Looking at the First Nations specific IRSEO index, Biddle & Markham (2023) find that inequalities in the average socioeconomic status of the First Nations population between areas widened between 2016 and 2021, based on comparison of raw IRSEO scores across the two Censuses. Between 2016 and 2021, the analysis indicated strong relative increases in socioeconomic outcomes for First Nations people in regional Australia, while in most of remote Australia, as well as most capital city regions, worsening relative socioeconomic outcomes were observed. The authors noted that some of the improvement in regional areas may have been due to uneven government restrictions during COVID-19, with urban areas more affected (Biddle & Markham 2023).
While socioeconomic indexes are useful for assessing differences in advantage and disadvantage between different geographic areas, they are less useful for assessing changes over time. It is therefore important to look at changes in the contributing indicators that make up these indexes, including education and employment outcomes (2.04 Literacy and numeracy, 2.05 Education outcomes for young people, 2.06 Education participation and attainment of adults, 2.07 Employment), earnings (2.08 Income), and housing conditions (2.01 Housing, 2.02 Access to functional housing with utilities).
Research and evaluation findings
In 2010, the World Health Organization (WHO) Commission on Social Determinants of Health published a discussion paper that conceptualised a framework for action on the social determinants of health. The paper analysed social, economic, and political mechanisms that stratify populations by income, education, occupation, gender, and race/ethnicity. It further sought to clarify foundational questions about the origins of health inequities, the pathways from these root causes to observed health disparities, and the necessary interventions to reduce these inequities. Key findings highlight the importance of addressing both structural determinants (such as governance, education systems, and labour market structures) and intermediary determinants (like material and psychosocial circumstances, behavioural factors and health systems) to effectively tackle health disparities. The paper emphasises intersectoral policymaking, civil society participation, and the empowerment of communities as crucial components for sustainable progress in health equity (Solar & Irwin 2010). These insights are particularly relevant to First Nations people who face significant health inequities due to these structural and intermediary determinants.
The relationship between socioeconomic status and health outcomes is typically characterised by poorer health for those of lower socioeconomic status – that is, health outcomes follow a social gradient. People with greater socioeconomic disadvantage will tend to have poorer health than those with lesser socioeconomic disadvantage (Adler & Stewart 2010; Keating & Hertzman 1999; Shepherd et al. 2012). This pattern exists across many countries, among different societies, across history, and extends to most measurable socioeconomic variables (such as poverty, employment, occupational status, education, housing and income) and across a range of health outcomes (including most aspects of physical and mental health) (Adler et al. 1994; Bhattacharya et al. 2013; Keating & Hertzman 1999; Marmot & Wilkinson R 2005; Shepherd et al. 2012). That said, the association of traditional socioeconomic status indicators with health in First Nations contexts may differ because of entrenched exclusion and discrimination, profound marginalisation limiting human development, and the influence of social factors like community wellbeing, cultural continuity, and connection to traditional lands (Shepherd et al. 2012).
The research literature also shows evidence of socioeconomic status disparities among First Nations people. Education, location, discrimination, health, disability, labour market discrimination and social norms all play a role in explaining disadvantage with no single factor dominating (Biddle 2015). Socioeconomic variables (such as weekly cash income, source of cash income and completed years of schooling) have been found to explain between one-third and one-half of the gap in self-assessed health status between First Nations people and non‑Indigenous Australians (Booth & Carroll 2008).
Socioeconomic status underlies three major determinants of health: health care, environmental exposure, and health behaviour. Chronic stress associated with lower socioeconomic status can also increase morbidity and mortality. Behavioural factors, linked to premature mortality, are significantly influenced by socioeconomic status rather than being purely lifestyle choices. For example, research has shown that smoking onset is not associated with education or income, rather those with less education are less likely to attempt quitting and those with lower income are less likely to succeed in quitting if they do try. Higher taxes on cigarettes can reduce consumption but disproportionately burden low-income smokers who lack resources for quitting support. Recognising that behaviours such as smoking, poor diet, and lack of exercise are shaped by constrained social and physical environments linked to socioeconomic status can shift the focus from victim-blaming to promoting ‘behavioural justice’, advocating for policies that ensure universal access to health-promoting resources. Reducing socioeconomic status disparities in health for a population requires a comprehensive approach that addresses education, income, and occupation, which collectively influence health outcomes. However, policies must also target social and physical environmental exposures, such as environmental hazards and social isolation, which disproportionately affect lower socioeconomic status groups. Additionally, improving access to quality health care and managing chronic stress are crucial to mitigating health inequalities driven by socioeconomic disparities (Adler & Newman 2002).
The mortality risk of First Nations Australians is still higher than that of non-Indigenous Australians. Research evidence shows that an ecological relationship exists between all-cause mortality, Indigenous status, remoteness and socioeconomic disadvantage across statistical divisions in Australia (Wilkinson D et al. 2001).
It is estimated that in the Northern Territory, socioeconomic status contributes between 25% and 30% of the health disparity, encompassing both quality of life (morbidity data) and life expectancy (mortality data), between First Nations people and non-Indigenous Australians. Moreover, mortality and morbidity rates in the low socioeconomic cohort were about double those in the medium socioeconomic cohort, which in turn were 50% higher than in the high socioeconomic cohort, with this gradient observed across most disease categories for both deaths and hospital admissions (Zhao et al. 2013).
Increased socioeconomic disadvantage is also associated with poor neighbourhood environments that hinder the ability of consumers to make healthy food and physical activity choices. Poor diet and insufficient physical activity are preventable risk factors contributing to the burden of disease from non-communicable diseases such as diabetes and cardiovascular diseases (Amarasinghe & D'Souza 2012; Darcy et al. 2022). Access to healthy food choices and physical activity environments are inequitably distributed across remote locations and areas of socioeconomic disadvantage (Achat et al. 2010; Phillips & Klein 2010; Veugelers & Yip 2003). Improving the neighbourhood contextual environment to provide access to healthy food choices and increased physical activity can be paramount in reducing non-communicable diseases and more broadly, health inequalities experienced by these communities (Darcy et al. 2022; Morton et al. 2021).
Increased socioeconomic disadvantage not only contributes to disease risk factors (poor nutrition, smoking and alcohol), but also limited access to preventative care including immunisations and health screening. Living in more socioeconomically disadvantaged areas increases the difficulty in accessing primary health care, leading to longer wait times and shorter consultation times, resulting in greater patient dissatisfaction. This suggests the manifestation of the ‘inverse care law’ hypothesis which describes the inadequacy of health services and social care trends for communities that need them the most (Furler et al. 2002; Furler & Young 2005; Hart 1971).
Access to primary health care services can reduce the disparities among the socioeconomically disadvantaged populations (Rosero-Bixby 2004; Starfield et al. 2005). High ratios of primary care physicians in deprived populations are associated with relatively greater effects on various aspects of health including lower post-neonatal mortalities (Shi et al. 1999; Shi & Starfield 2000). Strengthening the workforce in socioeconomically disadvantaged areas with trained general practitioners (GPs) can alleviate the medical, psychological and social needs of the most socioeconomically disadvantaged within Australia’s evolving primary health care system (Moad et al. 2022).
The proportion of First Nations people who were living in appropriately sized housing (not overcrowded) was highest in the least socioeconomically disadvantaged areas of Australia in 2021 and declined with increased remoteness and socioeconomic disadvantage (Productivity Commission 2023). Evidence shows that housing conditions affect human health, productivity and wellbeing. Many First Nations communities in Australia experience high rates of severe overcrowding, homelessness and very poor dwelling conditions. Basic amenities required to engage in ‘Healthy Living Practices’ (HLPs) – including flushing toilets, facilities required to bathe, wash clothes or prepare and store food adequately – have been found missing or non-functional in a substantial proportion of First Nations households (Andersen et al. 2017; Bailie et al. 2010).
Socioeconomic status has been linked with increased injury burden (burns, poisoning and transport injuries) in First Nations people (Möller 2017). Road trauma is a major health issue in rural and remote regions of Australia, especially for First Nations communities, who are at a higher risk of fatal road incidents compared with those in metropolitan areas. Living in remote areas often means limited access to medical care, jobs, training and social services, despite a strong community culture of helping each other. Systemic barriers, like inadequate road safety education and resources, contribute to risky driving behaviours. Moreover, remote First Nations communities face difficulties such as poorly maintained roads, geographical isolation, and limited access to safe vehicles and funds for maintenance. These challenges are part of the broader socioeconomic circumstances impacting these communities (Edmonston et al. 2020; Mason et al. 2022; Pammer et al. 2021).
Analysis of data for 2017–19 showed that an estimated 35% of the health gap was explained by social determinants driven by socioeconomic and environmental factors, and a further 30% by selected health risk factors (AIHW 2024b). Of the 35% of the health gap due to social determinants, the largest effects were due to differences in employment status and hours worked (contributing to 14% of the health gap), equivalised household income (contributing to 13% of the health gap), and the highest level of school attainment (8.9% of the health gap). Of the 30% of the health gap due to risk factors, the largest effects were due to differences in current smoking rates (contributing 13% of the health gap) and overweight and obesity rates (contributing to 11% of the health gap). This analysis did not explain about 35% of the health gap. The unexplained health gap includes possible effects from factors that might have contributed to good health but were not available in the survey data analysed. For example, these factors could include access to affordable and culturally appropriate health care services, and effects of structural disadvantage and racism (AIHW 2024a).
Evidence shows that the level of income inequality within a society is associated with societal function, for example rates of violence, incarceration, communal trust, feelings of exclusion, stress, and educational performance. The effect on health outcomes is not entirely explained by income inequality, rather it is also impacted by those societal conditions (Marmot 2016; Wilkinson R & Pickett 2009; Wolfson et al. 1999). Reducing health inequalities requires ensuring fairness and equity within society, not merely focusing on economic growth or wealth accumulation, but ensuring all individuals have equitable opportunities to lead healthy lives. A justice-oriented approach should create a societal framework where resources, opportunities, support systems – such as quality education, health care, housing, and employment – are accessible to everyone, and promotes social cohesion and inclusion (Marmot 2016).
A mixed methods research study in 2017 aimed to statistically validate the holistic Interplay Wellbeing Framework and Survey, which integrates First Nations-identified priorities (culture, empowerment, community) with government priorities (education, employment, health). Survey data from 2014 to 2015 was collected to investigate the wellbeing of around 840 First Nations people aged 15-34 in four remote First Nations communities across the Northern Territory and Western Australia. The study found direct impacts on wellbeing from social and emotional wellbeing, English literacy and numeracy, First Nations literacy, lack of substance use, work, and community. Culture, empowerment, and community all correlated strongly with each other, while empowerment strongly correlated with education, work and overall wellbeing. Culture had indirect impacts on education (English literacy and numeracy) mediated by positive links with First Nations literacy. Reduced substance use (tobacco and alcohol) was linked with better outcomes across culture, education, and work. The study confirmed the importance of culture, empowerment and community in the system of wellbeing affecting education, employment and health. It supports First Nations views of health and wellbeing as a holistic concept where everything is connected. Moreover, that policy should consider this ‘whole of system’ approach and build from First Nations priority areas of culture, empowerment, and community (Cairney et al. 2017).
A follow-up study in 2019 used structural equation modelling of the survey data to quantify relationships between health-care access, mental and physical health, and wellbeing to guide services in enhancing wellbeing for First Nations people in remote regions. The study found that there was no statistically significant association between health care access and wellbeing. However, mental health was positively associated with wellbeing for participants in both Remote and Very remote communities. Mental health also mediated a positive effect of health care access on wellbeing for participants in Remote communities but did not influence the negative direct association for participants in Very remote communities. The study considers the possibility that high staff turnover and non-Indigenous practitioners in Very remote communities could lead to poor communication, differing priorities, and feelings of disempowerment and alienation among First Nations people, undermining potential wellbeing improvements from healthcare access. The main barriers to health-care access were transport and cost. This study concludes that enhancing mental health and wellbeing for First Nations people in remote communities can be achieved through strengthening services outside the health sector that focus on relationships, empowerment, and cultural identity, which may also alleviate socioeconomic disadvantages. Moreover, the aggregation of Remote and Very remote populations may obscure important differences between First Nations communities (Schultz et al. 2019).
The relationship between low socioeconomic status and health also exists in reverse. Poor health is a contributor to poor socioeconomic circumstances. A study in Australia found that people with serious chronic illnesses, and their carers, faced greater financial stress. Evidence shows that severe chronic disease can lead to reduced work hours or leaving work entirely, resulting in decreased income and wealth. These decreases cannot be fully explained by higher medical expenses, as the reduced income does not entirely account for the loss in wealth (Bhattacharya et al. 2013; Jeon et al. 2009).
Implications
Health is influenced by social determinants and individual health risk factors. Social determinants of health refer to the circumstances in which people are born, grow up, live, work and age, and the systems put in place to deal with illness. These circumstances are in turn shaped by a wider set of forces such as economics, social policies, and politics (Marmot et al. 2008).
The differences in health status or in the distribution of health resources between different population groups are largely due to material factors like low income and exposure to health risks, psychosocial stress from low socioeconomic status, and a higher prevalence of unhealthy behaviours such as smoking and poor diet among people in disadvantaged areas. There is a need for effective policies to reduce health inequalities and comprehensive strategies to address both upstream factors such as income and education and further downstream factors such as health behaviours. Setting targets and achieving reductions in health disparities can yield substantial economic benefits by improving overall health and reducing health-care and social security costs (Mackenbach et al. 2007; WHO 2018).
Understanding the differences in the socioeconomic status-health relationship for First Nations populations is crucial for effective policymaking. The Australian Government’s commitment to closing the health gap between non-Indigenous and First Nations populations requires addressing more relevant drivers of ill health beyond education and income transfers. If education and income are not as strongly associated with health outcomes for First Nations populations as initially thought, then policies will need to focus more on other critical social and cultural factors that drive ill health to achieve significant improvements and reduce disparities (Shepherd et al. 2012).
The colonisation of First Nations people is seen as a fundamental underlying health determinant, requiring self-determination to reverse its impact. Research should focus on improving health, not the structural characterisation of ill health, within a holistic paradigm that includes the mental, physical, cultural and spiritual wellbeing of both the individual and the community. Strategies for enhancing First Nations wellbeing include ecological sustainability, political empowerment, cultural respect, economic prosperity, effective healing systems and nurturing family and individual support. Specific strategies involve promoting First Nations-led governance of community based development programs and projects in health systems, addressing poverty, supporting traditional healing practices and fostering resilience within families and individuals (Commission on Social Determinants of Health 2007).
In 2016, an international study explored the education of health professionals on social determinants of health to address root causes of ill health and improve outcomes for under-served populations. A framework was developed with three key components: education, community and organisation. It encompassed lifelong, experiential and collaborative learning across all professional development levels, mutual commitment and partnerships based on community-identified priorities, and policies and leadership that support addressing social determinants of health. Achieving lasting impacts requires multi-level action from stakeholders, including health professionals, community health workers and non-health sectors. This includes the need for sustained financial support and investment in health professional education, noting that without it, efforts will remain fragmented and insufficient. Governments can play a role in guiding health professional education by reallocating funds and implementing requirements based on evidence of financial savings or improved health outcomes. Involving funders and payers in discussions and building a data-driven business case can help redirect funding and advocate for integrating social determinants of health into the education of health professionals (National Academies of Sciences Engineering and Medicine 2016).
Culturally valid understandings must shape the provision of services and guide assessment, care and management of First Nations people’s health. In 2017, the Australian Government released My Life My Lead - Opportunities for strengthening approaches to the social determinants and cultural determinants of First Nations health: Report on the national consultations (My Life, My Lead). These consultations provided an opportunity for First Nations communities and leaders, governments, non‑government and the private sector to inform the refresh of the National Aboriginal and Torres Strait Islander Health Plan 2013–2023, which led to the National Aboriginal and Torres Strait Islander Health Plan 2021–2031. The My Life My Lead consultations highlighted that although there have been significant health gains, poor access to health and ‘wrap around’ services contributes to the significant health inequities still experienced by First Nations people (Department of Health 2017).
This summary measure supplements what is known and reported in other measures about the relative disadvantage that First Nations people experience across a wide spectrum of social and economic issues. Disaggregating data by socioeconomic status and by region across health and social outcomes, where the data allows, will help identify areas in which there is a high need. This will assist in addressing the broader social determinants to improve health outcomes and guide future policy responses.
It is also important to note that area-based socioeconomic indexes can be at risk of the ecological fallacy. The socioeconomic status of an area as a whole will not always reflect the socioeconomic status of its First Nations residents. Policy reforms that are based on aggregate area level measures may not be helpful to overcome individual socioeconomic disadvantage. Thus, one stand-alone socioeconomic indicator may not be adequate to understand complex health disparities among First Nations communities.
(See measures 2.04 Literacy and numeracy, 2.05 Education outcomes for young people, 2.06 Education participation and attainment of adults, 2.07 Employment, and 2.08 Income).
The Policy context is at Policies and strategies.
References
- ABS (Australian Bureau of Statistics) 2008. Information Paper: An Introduction to Socio-Economic Indexes for Areas (SEIFA), 2006 Canberra. Viewed 30/05/2024.
- ABS 2016. 2016 Census - counting persons, place of usual residence [Census TableBuilder Pro product]. Viewed 30/05/2024.
- ABS 2018. 2081.0 - Australians' journeys through life: Stories from the Australian Census Longitudinal Dataset, ACLD. Viewed July 2024.
- ABS 2021a. Socio-Economic Indexes for Areas (SEIFA), Australia. ABS. Canberra: Australian Bureau of Statistics. Viewed July 2024.
- ABS 2021b. Understanding change in counts of Aboriginal and Torres Strait Islander Australians: Census. Viewed July 2024.
- ABS 2022. 2021 Census - counting persons, place of usual residence [Census TableBuilder Pro product]. Viewed December 2022.
- Achat HM, Thomas P, Close GR, Moerkerken LR & Harris MF 2010. General health care service utilisation: where, when and by whom in a socioeconomically disadvantaged population. Aust J Prim Health 16:132-40.
- Adler NE, Boyce T, Chesney MA, Cohen S, Folkman S, Kahn RL et al. 1994. Socioeconomic status and health: the challenge of the gradient. American psychologist 49:15.
- Adler NE & Newman K 2002. Socioeconomic Disparities In Health: Pathways And Policies. Health Aff (Millwood) 21:60-76.
- Adler NE & Stewart J 2010. Health disparities across the lifespan: meaning, methods, and mechanisms. Annals of the New York Academy of Sciences 1186:5-23.
- AIHW (Australian Institute of Health and Welfare) 2016. Australian Burden of Disease Study: impact and causes of illness and death in Aboriginal and Torres Strait Islander people 2011. AIHW, Australian Government.
- AIHW 2022. Australian Burden of Disease Study: impact and causes of illness and death in Aboriginal and Torres Strait Islander people 2018. AIHW, Australian Government.
- AIHW 2024a. Aboriginal and Torres Strait Islander health performance framework: summary report 2024. AIHW, Australian Government.
- AIHW 2024b. Determinants of health for First Nations people, Australia's Health 2024. AIHW, Australian Government.
- AIHW 2024c. Social determinants of health. AIHW, Australian Government. Viewed July 2024.
- Amarasinghe A & D'Souza G 2012. Individual, Social, Economic, and Environmental Model: A Paradigm Shift for Obesity Prevention. ISRN public health 2012:1-10.
- Andersen MJ, Williamson AB, Fernando P, Wright D & Redman S 2017. Housing conditions of urban households with Aboriginal children in NSW Australia: tenure type matters. BMC Public Health 18:70.
- Baciu A, Negussie Y & Geller A 2017. Communities in Action: Pathways to Health Equity. Washington (DC): National Academies Press (US).
- Bailie R, Stevens M, McDonald E, Brewster D & Guthridge S 2010. Exploring cross-sectional associations between common childhood illness, housing and social conditions in remote Australian Aboriginal communities. BMC Public Health 10:147.
- Bhattacharya J, Hyde T & Tu P 2013. Health economics. Macmillan International Higher Education.
- Biddle N 2015. Entrenched Disadvantage in Indigenous Communities. In: Australia CfEDo (ed.). Addressing Entrenched Disadvantage in Australia,. Melbourne: CEDA, 63-80.
- Biddle N & Markham F 2018. Indigenous identification change between 2011 and 2016: evidence from the Australian Census Longitudinal Dataset. Centre for Aboriginal Economic Policy Research.
- Biddle N & Markham F 2023. Area-level socioeconomic outcomes for Aboriginal and Torres Strait Islander Australians in the 2016 and 2021 Censuses (Working Paper No.144/2023). Centre for Aboriginal Economic Policy Research, Australian National University, https://doi.org/10.25911/DY8M-S345.
- Booth AL & Carroll N 2008. Economic status and the Indigenous/non-Indigenous health gap. Economics Letters 99:604-6.
- Brown N 2012. Pacific Caucus Intervention to the 12th Session of the United Nations Permanent Forum on Indigenous Issues. New York: United Nations.
- Cairney S, Abbott T, Quinn S, Yamaguchi J, Wilson B & Wakerman J 2017. Interplay wellbeing framework: a collaborative methodology ‘bringing together stories and numbers’ to quantify Aboriginal cultural values in remote Australia. International Journal for Equity in Health 16:68.
- Commission on Social Determinants of Health 2007. Social determinants and Indigenous health: The International experience and its policy implications
- Darcy M, Parkinson J, McDonald N, Moriarty S, Kadariya S & Sapkota D 2022. Geographic remoteness and socioeconomic disadvantage reduce the supportiveness of food and physical activity environments in Australia. Aust N Z J Public Health 46:346-53.
- Department of Health and Aged care 2017. My Life My Lead - Opportunities for strengthening approaches to the social determinants and cultural determinants of Indigenous health: Report on the national consultations December 2017. Canberra: Commonwealth of Australia.
- Edmonston C, Siskind V & Sheehan M 2020. Understanding the Roles of Remoteness and Indigenous Status in Rural and Remote Road Trauma in North Queensland: Using a Mixed-Methods Approach. Int J Environ Res Public Health 17:1467.
- Furler J, Harris E, Chondros P, Powell Davies PG, Harris MF & Young DY 2002. The inverse care law revisited: impact of disadvantaged location on accessing longer GP consultation times. Med J Aust 177:80-3.
- Furler J & Young D 2005. Prevention and socioeconomic disadvantage. Aust Fam Physician 34:821-4.
- Hart JT 1971. The inverse care law. Lancet 1:405-12.
- Hill-Briggs F, Adler NE, Berkowitz SA, Chin MH, Gary-Webb TL, Navas-Acien A et al. 2020. Social Determinants of Health and Diabetes: A Scientific Review. Diabetes Care 44:258-79.
- Jeon Y-H, Essue B, Jan S, Wells R & Whitworth JA 2009. Economic hardship associated with managing chronic illness: a qualitative inquiry. BMC health services research 9:182.
- Keating DP & Hertzman C 1999. Modernity’s paradox. Developmental health and the wealth of nations:1-17.
- Kennedy B & Firman D 2004. Indigenous SIFA- Revealing the ecological fallacy. Population and society: issues, research, policy. (ed., Australian Population Association). Canberra: APA.
- Mackenbach JP, Meerding WJ & Kunst AE 2007. Economic implications of socio-economic inequalities in health in the European Union. European Commission.
- Marmot M, Friel S, Bell R, Houweling TAJ, Taylor S & Commission Social Determinants H 2008. Closing the gap in a generation: health equity through action on the social determinants of health. Lancet 372:1661-9.
- Marmot M & Wilkinson R 2005. Social determinants of health. OUP Oxford.
- Marmot M 2016. 2016 Boyer Lectures: Fair Australia: Social Justice and the Health Gap. ABC Radio, Sep 2016. https://www.abc.net.au/radionational/programs/bigideas/boyers-3&4/7819306: Australian Broadcasting Corporation.
- Mason HM, Leggat PA, Voaklander D & Franklin RC 2022. Road traffic fatalities in rural and remote Australia from 2006 to 2017: The need for targeted action. Aust J Rural Health 30:252-63.
- Moad D, Tapley A, Fielding A, van Driel ML, Holliday EG, Ball JI et al. 2022. Socioeconomic status of practice location and Australian GP registrars’ training: a cross-sectional analysis. 22:285.
- Möller H 2017. Inequalities in unintentional injury hospitalisation between Aboriginal and non-Aboriginal children in New South Wales, Australia. University of New South Wales, Sydney, Australia.
- Morton JI, Ilomӓki J, Magliano DJ & Shaw JE 2021. The association of socioeconomic disadvantage and remoteness with receipt of type 2 diabetes medications in Australia: a nationwide registry study. Diabetologia 64:349-60.
- National Academies of Sciences Engineering and Medicine 2016. A framework for educating health professionals to address the social determinants of health.
- Pammer K, Freire M, Gauld C & Towney N 2021. Keeping Safe on Australian Roads: Overview of Key Determinants of Risky Driving, Passenger Injury, and Fatalities for Indigenous Populations. Int J Environ Res Public Health 18.
- Productivity Commission 2023. Closing the Gap Annual Data Compilation Report July 2023. Canberra, Australia: Productivity Commission.
- Phillips JE & Klein WM 2010. Socioeconomic Status and Coronary Heart Disease Risk: The Role of Social Cognitive Factors. Soc Personal Psychol Compass 4:704-27.
- Rosero-Bixby L 2004. Spatial access to health care in Costa Rica and its equity: a GIS-based study. Soc Sci Med 58:1271-84.
- Schultz R, Quinn S, Wilson B, Abbott T & Cairney S 2019. Structural modelling of wellbeing for Indigenous Australians: importance of mental health. 19:488.
- Shepherd C, Li J & Zubrick S 2012. Social gradients in the health of Indigenous Australians. American Journal of Public Health 102:107-17.
- Shi L & Starfield B 2000. Primary care, income inequality, and self-rated health in the United States: a mixed-level analysis. Int J Health Serv 30:541-55.
- Shi L, Starfield B, Kennedy B & Kawachi I 1999. Income inequality, primary care, and health indicators. J Fam Pract 48:275-84.
- Solar O & Irwin A 2010. A conceptual framework for action on the social determinants of health. Social Determinants of Health Discussion Paper 2 (Policy and Practice). World Health Organization.
- Starfield B, Shi L & Macinko J 2005. Contribution of primary care to health systems and health. Milbank Q 83:457-502.
- Verbunt E, Luke J, Paradies Y, Bamblett M, Salamone C, Jones A et al. 2021. Cultural determinants of health for Aboriginal and Torres Strait Islander people – a narrative overview of reviews. 20:181.
- Veugelers PJ & Yip AM 2003. Socioeconomic disparities in health care use: Does universal coverage reduce inequalities in health? J Epidemiol Community Health 57:424-8.
- World Health Organisation 2018. Health inequities and their causes. Viewed July 2024.
- Wilkinson D, Ryan P & Hiller J 2001. Variation in mortality rates in Australia: correlation with Indigenous status, remoteness and socio-economic deprivation. Journal of Public Health 23:74-7.
- Wilkinson R & Pickett K 2009. Income Inequality and Social Dysfunction. Annual Review of Sociology 35:493-511.
- Williamson L, Dent P & Bowman N 2020. Culture is Key: towards cultural determinants-driven health policy–final report. Lowitja Institute: Melbourne, Australia.
- Wolfson M, Kaplan G, Lynch J, Ross N & Backlund E 1999. Relation between income inequality and mortality: empirical demonstration. British Medical Journal 319:953-5.
- Zhao Y, You J, Wright J, Guthridge SL & Lee AH 2013. Health inequity in the Northern Territory, Australia. International Journal for Equity in Health 12:79-.