
Key messages
- English literacy and numeracy, as well as literacy in Aboriginal languages, have strong impacts on wellbeing. People with higher educational attainment tend to have better health, higher incomes and improved employment prospects and other opportunities. Length and quality of education is associated with future employment opportunities and income, and increased social mobility.
- In 2023, averaging results for Aboriginal and Torres Strait Islander (First Nations) students across the five NAPLAN learning areas, about one-third (29% to 35%) of First Nations students in each year level met or exceeded proficiency expectations (‘Strong’ or ‘Exceeding’). Another third (30% to 34%) had results in the ‘Developing’ category, indicating they were working towards expectations. The remaining third (32% to 34%) had results in the ‘Needs additional support’ category.
- NAPLAN results for First Nations students were lower in more remote areas. For example, in 2023, among First Nations students in Year 3, the average proportion meeting or exceeding expectations across the five learning areas was 39% in Major cities, 37% in Inner regional areas, and 30% in Outer regional areas, compared with 17% in Remote areas, and 8% in Very remote areas.
- Averaged across the five learning areas, a greater proportion of First Nations students needed additional academic support compared with non-Indigenous students (32–34% across year levels, compared with 7–9%). Conversely, fewer First Nations students were meeting or exceeding proficiency expectations compared with non-Indigenous students (29%–35%, compared with 65%–71).
- The disparities in average scale scores between First Nations and non-Indigenous students were higher for those living in remote areas compared with those in non-remote areas.
- From 2013 to 2022, for Year 3 First Nations students, the NAPLAN average scale score for reading and writing improved by 7.4% and 7.3%, respectively. There was also a reduction in the gap between First Nations and non-Indigenous students in writing (by 14.8%), but an increase in the gap in spelling (by 10.2%) due to improvements in the average score in spelling for non-Indigenous students.
- From 2013 to 2022, for Year 5 First Nations students, improvements in the NAPLAN average scale score were observed in writing (by 4.4%), spelling (3.6%), and numeracy (2.6%). The absolute gap in average scale scores between First Nations and non-Indigenous students remained similar across all learning areas, except for grammar and punctuation, where the gap narrowed by 13%.
- School attendance is key to school outcomes for First Nations students. Research shows that children who attend early childhood education have better Year 3 literacy and numeracy results. Analysis of data from the 2009 Longitudinal Survey of Australian Youth indicated that 18% of the gap in performance in maths and around 21% of the gap in reading between First Nations and non-Indigenous 15-year-olds in 2009 was explained by lower school attendance by First Nations students.
- Mental health and wellbeing can play a significant role in educational outcomes for First Nations students, particularly attendance. School attendance rates can be affected by feelings of anxiety, shame and alienation. Emotional difficulties have also been linked to low academic performance of First Nations students. In addition, hearing loss among children is associated with linguistic, social and learning difficulties in schools.
- Research has shown that if First Nations and non-Indigenous students reach the same level of academic achievement by the time they are 15, there is no significant difference in subsequent educational outcomes such as completing Year 12 and participating in university or vocational training. However, currently, a gap emerges well before this point.
- Incorporating Aboriginal or Torres Strait Islander languages into school curricula have resulted in improvements in school attendance, engagement and learning outcomes, as well as increased self-esteem of young First Nations students.
- A pilot project, Improving Outcomes for Aboriginal and Torres Strait Islander Students, succeeded in improving students’ literacy and numeracy outcomes, and increasing their level of engagement and confidence, by building strong relationships with the student, family and community, as well as providing culturally sensitive and individualised support.
- Research also indicates that stronger progress in numeracy is associated with higher levels of parental involvement in school activities, attending a school that parents perceive to be ‘good for Indigenous children’, and fewer experiences of racist bullying.
- Low adult literacy has intergenerational effects, as it places limitations on adults attempting to foster literacy skills among children, both in terms of modelling effective literacy to children and also in families’ ability to establish effective relationships with their children’s school. First Nations-led literacy programs like the ‘Yes I can!’ campaign have been shown to improve adult literacy and reduce contact with the criminal justice system.
Why is it important?
There is a two-way association between health and education. People with higher educational attainment tend to have better health, higher incomes and improved employment prospects and other opportunities (Conti et al. 2010; Raghupathi & Raghupathi 2020). In turn, better health is associated with better educational attainment (Hale & Viner 2018). For example, vision and hearing loss (see measures 1.15 Ear health and 1.16 Eye health) are associated with linguistic, social and learning difficulties and behavioural problems in school. These problems can lead to reduced educational performance and indeed reduced reading ability (Hopkins et al. 2017). Other health factors impacting the education outcomes of Aboriginal and Torres Strait Islander (First Nations) students are low birthweight and fetal alcohol spectrum disorder (Su et al. 2020). Conversely, education can create opportunities for better health. Length and quality of education is associated with future employment opportunities and income, and opportunities to escape the poverty cycle. These social and economic outcomes in future can influence an individual’s access to health care and quality of life (Zajacova & Lawrence 2018).
Successfully progressing through and transitioning from school is also important for children to improve social mobility and intergenerational outcomes. Education has a strong association with employability and income, health, and control over one’s life (AIHW 2014b; Bank 2018; Klees et al. 2019). Better education outcomes can also have positive intergenerational flow-on effects. More educated mothers, for example, have been associated with healthier children (Ewald & Boughton 2002; Schochet et al. 2020).
Education outcomes for First Nations people, and the gap between First Nations and non-Indigenous education outcomes, need to be understood in context. Colonisation and subsequent discriminatory government policies have had a devastating impact on First Nations people and cultures. This history and the ongoing effects of entrenched disadvantage, political exclusion, intergenerational trauma, and institutional racism have fundamentally affected the health risk factors, social determinants of health and wellbeing, and health outcomes for First Nations people (AIHW 2022; Productivity Commission 2022).
The National Agreement on Closing the Gap (the National Agreement) was developed in partnership between Australian governments and the Coalition of Aboriginal and Torres Strait Islander Peak Organisations. The National Agreement has been built around four Priority Reforms that have been directly informed by First Nations people. These reforms are central to the National Agreement and will change the way governments work with First Nations people, including through working in partnership and sharing decision making, building the Aboriginal community-controlled sector, transforming government organisations, and improving and sharing access to data and information to enable informed decision making by First Nations communities. The National Agreement has identified the importance of First Nations students achieving their full learning potential. To support this outcome the National Agreement includes the following targets to direct policy attention and monitor progress:
- Target 3 - By 2025, increase the proportion of Aboriginal and Torres Strait Islander children enrolled in Year Before Fulltime Schooling (YBFS) early childhood education to 95 per cent.
- Target 4 - By 2031, increase the proportion of Aboriginal and Torres Strait Islander children assessed as developmentally on track in all five domains of the Australian Early Development Census (AEDC) to 55 per cent.
- Target 5 - By 2031, increase the proportion of Aboriginal and Torres Strait Islander people (age 20-24) attaining year 12 or equivalent qualification to 96 per cent (see measure 2.06 Educational participation and attainment of adults).
For the latest data on the Closing the Gap targets, see the Closing the Gap Information Repository.
Data findings
This section mainly presents data from the NAPLAN. NAPLAN is an annual assessment for students in Years 3, 5, 7 and 9 that includes tests in reading, writing, spelling, grammar and punctuation, and numeracy. These tests aim to determine whether young Australians are developing the literacy and numeracy skills that provide the critical foundation for other learning. Various changes were made to the NAPLAN in 2023 – see Box 2.04.1. Note that as a result of these changes, 2023 NAPLAN data are not comparable with those from previous years.
The average participation rates for First Nations students across the five learning areas were:
- 87% in Year 3 (between 18,362 and 18,696 participating students depending on learning area, of around 21,240 enrolled students)
- 88% in Year 5 (between 18,602 and 18,953 participating students, of around 21,430 enrolled)
- 82% in Year 7 (between 16,787 and 17,602 participating students, of around 20,840 enrolled)
- 69% in Year 9 (between 14,042 and 14,866 participating students, of around 20,810 enrolled) (AIHW analysis of ACARA 2023).
This varied by jurisdiction and remoteness (Figure 2.04.1).
The participation rates should be considered when interpreting the results – higher participation rates mean the results will be more representative of all students in that area.
Figure 2.04.1. NAPLAN participant rates of First Nations students, by school year, jurisdiction and remoteness, 2023
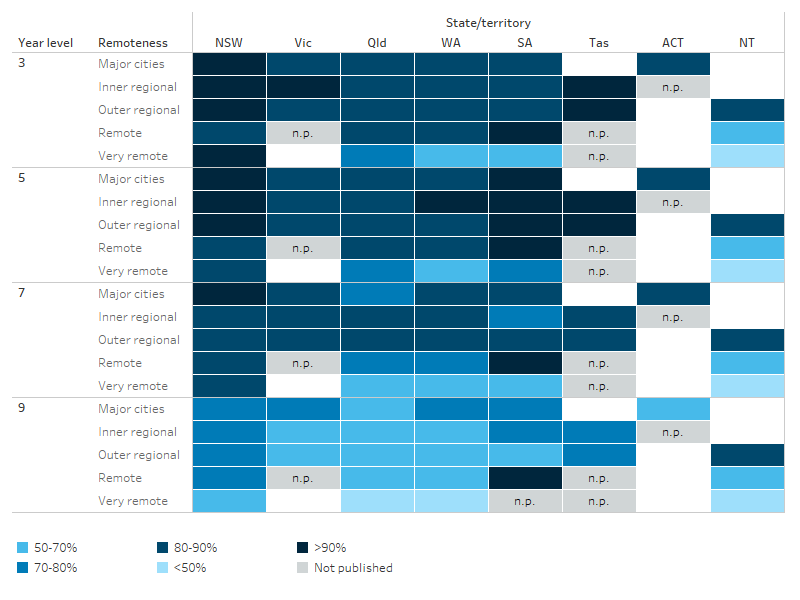
Note: Participation rates for Year 9 students, Very remote areas of New South Wales are based on Writing only.
Source: AIHW analysis of NAPLAN national results (ACARA 2023).
For students who participated in the NAPLAN in 2023, results are reported in the following categories:
- Exempt: Some, but not all, students with a language background other than English who arrived from overseas less than a year before the tests, or with significant disabilities, were exempted from testing.
- Exceeding: the student’s result exceeds expectations at the time of testing.
- Strong: the student’s result meets challenging but reasonable expectations at the time of testing.
- Developing: the student’s result indicates that they are working towards expectations at the time of testing.
- Needs additional support: the student’s result indicates that they are not achieving the learning outcomes expected at the time of testing. They are likely to need additional support to progress satisfactorily.
In this measure, when calculating the proportions of students at each of the four proficiency levels, students classified as ‘exempt’ are included in the denominator, consistent with Australian Curriculum and Assessment Reporting Authority (ACARA) conventions. On average, based on the rates across the five learning areas, the proportion of First Nations students who were assessed as Exempt in 2023 was:
- 2.9% in Year 3 (between 599 and 609 students across the five learning areas)
- 2.7% in Year 5 (between 581 and 585 students)
- 2.8% in Year 7 (between 579 and 585 students)
- 3.2% in Year 9 (between 672 and 676 students) (Table D2.04.19, ACARA 2023).
This rate, based on the rates across the five learning areas and all assessed school years, varied by state and territory from 1.7% in Western Australia to 6.8% in South Australia, and by remoteness area from 1.7% in Very remote areas to 3.6% in Remote areas (Tables D2.04.19, D2.04.20).
National
NAPLAN results for First Nations students averaged across the five learning areas are shown in Table 2.04–1. On average, for First Nations students in Year 3 in 2023, 33% met or exceeded the expected proficiency levels (result of ‘Exceeding’ or ‘Strong’), and 31% were working towards expectations (result of ‘Developing’). A further 33% were not achieving the outcomes expected at the time of testing, and were likely to need additional support (result of ‘Needs additional support (Table 2.04-1).
Results for students in Years 5, 7 and 9 were broadly similar to those for students in Year 3, with about one-third of First Nations students in each year meeting or exceeding expectations (29% to 35%), about another third working towards expectations (30% to 34%), and about another third needing additional support (32% to 34%) (Table D2.04.19).
Table 2.04-1: NAPLAN results for First Nations students, averaged across the five learning areas, by Indigenous status and year level, 2023
| Exempt (%) | Needs additional support (%) | Developing (%) | Strong (%) | Exceeding (%) | |
|---|---|---|---|---|---|
| Year 3 | 2.9 | 33.1 | 31.3 | 30.0 | 2.7 |
| Year 5 | 2.7 | 31.8 | 30.3 | 32.0 | 3.2 |
| Year 7 | 2.8 | 33.1 | 30.8 | 30.0 | 3.3 |
| Year 9 | 3.2 | 33.7 | 34.1 | 26.0 | 3.0 |
Note: Data have been averaged across the five learning areas: reading, writing, spelling, grammar and punctuation, and numeracy. The number of students who participated in the NAPLAN, and the distribution by proficiency levels, varied somewhat by year level and learning area – see Tables D2.04.1, D2.04.3, D2.04.5, D2.04.7 and D2.04.9 for results by area.
Source: Average of data in Tables D2.04.19, and AIHW analysis of NAPLAN national results (ACARA 2023).
Looking at results by learning area, in 2023, the proportion of First Nations students assessed who met or exceeded proficiency expectations at the time of testing was:
- highest for writing for students in Year 3, with 43% of students achieving a Strong or Exceeding proficiency level
- highest for reading for students in Year 5, with 41% of students achieving a Strong or Exceeding proficiency level
- highest for spelling for students in Years 7 and 9, with between 42% and 45% achieving a result in the Strong or Exceeding proficiency levels (Figure 2.04.2).
Grammar and punctuation was consistently the lowest for students of all year levels, with between 22% and 29% achieving a Strong or Exceeding proficiency level.
Across year levels and learning areas, the proportion of students whose results were exceeding expectations at the time of testing was highest for spelling in all year levels (that is, a result of Exceeding) and ranged from 4.5% to 6.2% in 2023. For reading, the proportion of students exceeding expectations ranged from 3.1% to 4.7%. The proportion of First Nations students assessed as exceeding expectations was relatively lower in writing (with 1.5% to 4.3% exceeding expectations), grammar and punctuation (from 1.2% to 2.0%), and numeracy (from 0.9% to 2.0%).
Across learning areas and year levels (3, 5, 7 and 9), the proportion of First Nations students assessed as needing additional support ranged between 24% (in Year 9 spelling) and 40% (Year 3 grammar and punctuation) (Table D2.04.1, D2.04.3, D2.04.5, D2.04.7 and D2.04.9).
Figure 2.04.2. Proportion of First Nations students achieving Strong or Exceeding proficiency levels, by school year and NAPLAN learning areas, 2023
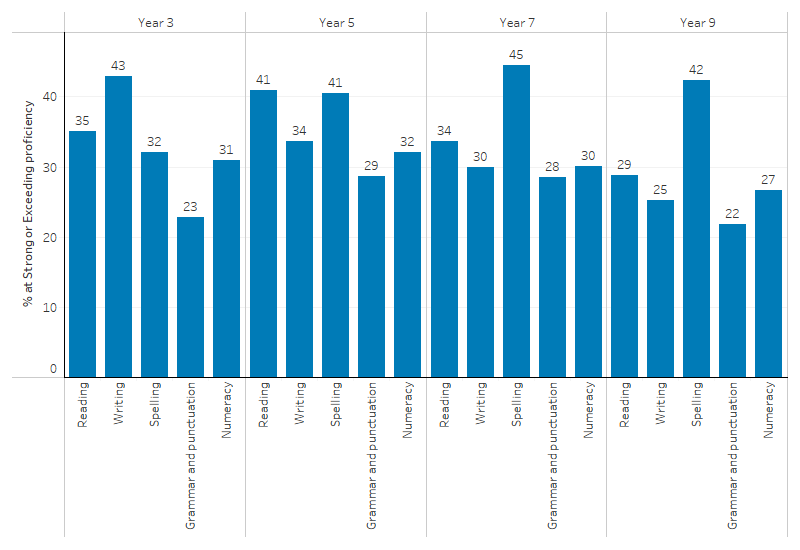
Source: Tables D2.04.1, D2.04.3, D2.04.5, D2.04.7 and D2.04.9. AIHW analysis of NAPLAN national results (ACARA 2023).
Looking at results nationally by learning area:
- Grammar and punctuation were the areas in which the highest proportion of First Nations students needed additional support, with 40%, 36%, 37%, and 39% of students in Years 3, 5, 7, and 9 respectively with a result of Needs Additional Support.
- Across year levels, between 28% and 33% of First Nations students needed additional support with reading.
- The proportion of First Nations students who needed additional support for writing was 26% for Year 3 students, increasing with each year level to 37% in Year 9.
- The proportion of First Nations students who needed additional support for spelling was highest in Year 3, at 35%, and decreased by year level to 24% in Year 9.
- Across school year levels, between 34% and 35% of First Nations students needed additional support with numeracy (Table D2.04.1, D2.04.3, D2.04.5, D2.04.7 and D2.04.9).
Remoteness areas
NAPLAN results for First Nations students were lower in more remote areas (Figure 2.04.3, Table D2.04.11).
On average, across all five learning areas, the percentage of students achieving Strong or Exceeding proficiency levels was lower in more remote areas. For example, among First Nations students in Year 3, the average proportion achieving Strong or Exceeding proficiency levels across the five learning areas was 39% in Major cities, 37% in Inner regional areas, and 30% in Outer regional areas, compared with 17% in Remote areas, and 8% in Very remote areas (Table D2.04.20, Figure 2.04.3).
Looking at results by learning areas, among Year 3 First Nations students, the disparity by remoteness was largest in spelling, with an average scale score in spelling of 351 in Major cities (out of a total scale score of 500) compared with 233 in Very remote areas, a difference of 117 points. For First Nations students in Years 5, 7, and 9, the difference in average scores by remoteness area was largest for writing. For Year 5, the average scores for writing were 434 in Major cities and 302 in Very remote areas, a difference of 132 points. In Year 7, the scores were 483 in Major cities versus 337 in Very remote areas, a difference of 146 points. Similarly, in Year 9, the scores were 509 in Major cities compared with 386 in Very remote areas, a difference of 123 points (Table D2.04.12).
Figure 2.04.3. Average proportion of First Nations students achieving Strong or Exceeding proficiency levels across five learning areas, by school year and remoteness areas, 2023
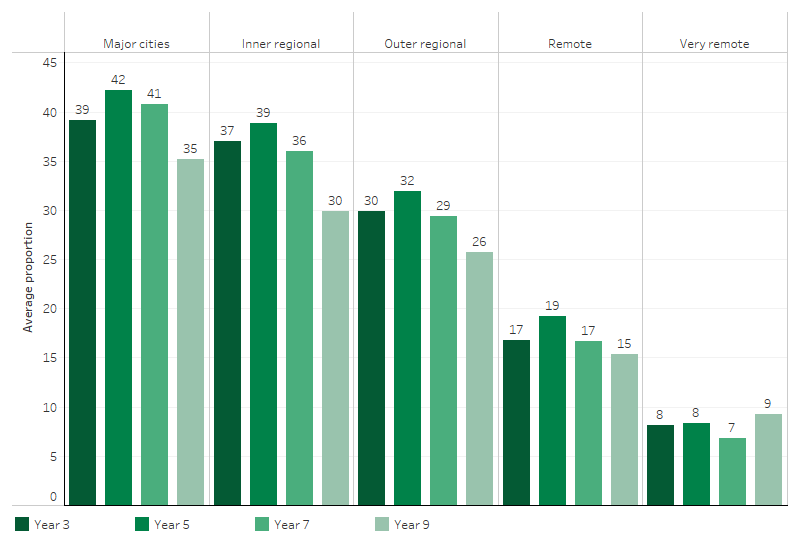
Note: Data have been averaged across the five learning areas.
Source: Averages of data in Tables D2.04.11. AIHW analysis of NAPLAN national results (ACARA 2023).
Conversely, across the five learning areas, First Nations students in Major cities had a lower proportion requiring additional academic support, ranging from 23% to 26% across different year levels. These figures were notably lower compared to Very remote areas, where the range was between 68% and 77% (Table D2.04.11, Figure 2.04.4).
Figure 2.04.4. Average proportion of First Nations students needing additional support across five learning areas, by school year and remoteness areas, 2023
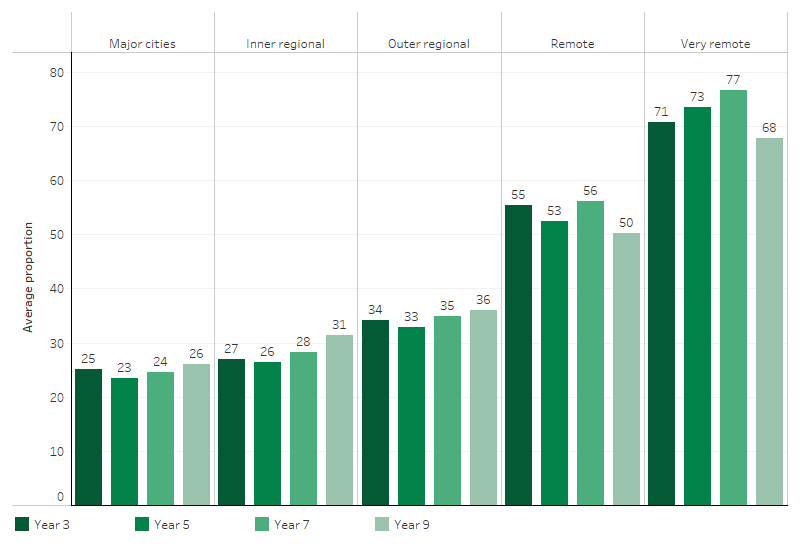
Note: Data have been averaged across the five learning areas.
Source: Averages of data in Tables D2.04.11.Table D2.04.20, AIHW analysis of NAPLAN national results (ACARA 2023).
State and territory
NAPLAN results in all five learning areas among Years 3, 5, 7, and 9 varied widely across states and territories.
When compared with the national average scale scores across all five learning areas, First Nations students in Years 3, 5, 7 and 9 living in New South Wales, Victoria and Tasmania consistently exceeded the national average in 2023. First Nations students in Queensland and the Australian Capital Territory, across the four school years, had average scale scores that either exceeded or were close to the national average for all learning areas. In South Australia, students achieved results similar to the national average in reading and spelling across the 4 school years, but proficiency results in writing, grammar and punctuation, and numeracy were lower. Conversely, First Nations students in Western Australia and the Northern Territory had results consistently below the national average in all school years across all five learning areas (Table D2.04.2, D2.04.4, D2.04.6, D2.04.8 and D2.04.10).
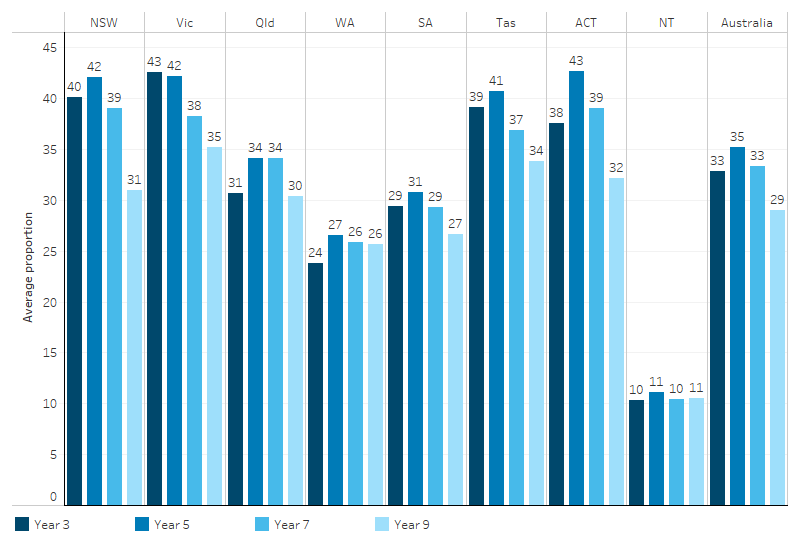
For First Nations students in Year 3:
- The average proportion with results that were meeting or exceeding expectations across the learning areas was higher than the national average (33%) in four jurisdictions: New South Wales (40%), Victoria (43%), Tasmania (39%), and the Australian Capital Territory (38%).
- On average across the learning areas, 31% in Queensland, 29% in South Australia, 24% in Western Australia, and 10% in the Northern Territory were meeting or exceeding expectations (Figure 2.04.5).
- Grammar and punctuation was the area with the highest proportion of students needing additional support in all jurisdictions. The proportion needing additional support was highest in the Northern Territory (73%), followed by Western Australia (52%) and Queensland (41%) (Table D2.04.19).
For First Nations students in Year 9:
- In New South Wales (31%), Victoria (35%), Queensland (30%), Tasmania (34%), and the Australian Capital Territory (32%), the average proportion of First Nations students who were meeting or exceeding expectations across the learning areas was higher than the national average of 29%.
- In Western Australia (26%), South Australia (27%), and the Northern Territory (11%), the average proportion of students who were meeting or exceeding expectations across the learning areas was lower than the national average (Figure 2.04.5).
- Grammar and punctuation was the learning area with the highest proportion of First Nations students needing additional support in South Australia (39%), Western Australia (44%), and the Northern Territory (70%) (Table D2.04.19).
The distribution of the student population by remoteness within each jurisdiction should be considered in the context of these data. Western Australia and the Northern Territory have a higher proportion of their First Nations student population attending schools in Remote or Very remote areas than the other jurisdictions. For example, among Year 3 First Nations students, 71% of those in the Northern Territory attended schools in Remote and very remote combined, as did 32% of those in Western Australia, compared with 13% or less in other jurisdictions (ACARA 2023). As shown in the previous section, NAPLAN results were consistently lower in more remote areas – this was also observed within states and territories. For example, within New South Wales, the average proportion of Year 3 students who were meeting or exceeding expectations across the five learning areas was 44% in Major cities, 40% in Inner regional areas, 31% in Outer regional areas, 24% in Remote areas, and 17% in Very remote areas (Table D2.04.11 NSW).
Additional data by state/territory and remoteness, including for First Nations students in Years 5 and 7, are available in the data downloads (Table D2.04.1, D2.04.3, D2.04.5, D2.04.7 and D2.04.9 and jurisdiction-specific tables of D2.04.11).
Figure 2.04.5. Average proportion of First Nations students achieving Strong or Exceeding proficiency levels across five learning areas, by school year and jurisdictions, 2023
Note: Data have been averaged across the five learning areas.
Source: Averages of data in Table D2.04.19. AIHW analysis of NAPLAN national results (ACARA 2023).
Comparisons with non-Indigenous students
NAPLAN results averaged across all five learning areas show a greater proportion of First Nations students requiring additional academic support compared with non-Indigenous students. Conversely, a higher proportion of non-Indigenous students were meeting or exceeding proficiency expectations. Averaged across the five learning areas:
- between 32% and 34% of First Nations students in each NAPLAN year level required additional academic support, compared with between 7% and 9% of non-Indigenous students.
- between 30% and 34% of First Nations students in each year level were found to be working towards expectations at the time of testing, compared with 21% to 25% of non-Indigenous students.
- between 29% and 35% of First Nations students in each year level were found to be meeting or exceeding proficiency expectations, compared with 65% to 71% of non-Indigenous students.
Looking at individual learning areas, average scale scores in 2023 were lower for First Nations students compared with non-Indigenous students in all year levels and learning areas, with the score gaps generally smaller in older year levels.
- Among Year 3 students, across learning areas, the average scale score for First Nations students ranged between 17% lower than non-Indigenous students in numeracy (341 compared with 412) to 20% lower in grammar and punctuation (335 compared with 417).
- For Year 5 students, the differences ranged from 14% lower for First Nations than non-Indigenous students in spelling (423 compared with 493) to 16% lower in grammar and punctuation (421 compared with 502).
- In Year 7, the average scale score for First Nations students ranged from 12% lower than non-Indigenous students (480 compared with 544) in spelling to 15% lower in numeracy (460 compared with 544).
- By Year 9, the differences ranged from 9.8% lower in spelling (515 compared with 571) to 15% lower in writing (487 compared with 572) (Table D2.04.2, D2.04.4, D2.04.6, D2.04.8 and D2.04.10).
The differences in average scale scores between First Nations and non-Indigenous students were higher for those living in Remote and Very remote areas compared with those in other regions. For example, among Year 3 students, the average scale score in spelling for First Nations students was 351 in Major cities, compared with 417 for non-Indigenous students, resulting in a difference of about 66 points (or 19% lower for First Nations students). In Remote areas, the average scale score for First Nations Year 3 students was 275, compared with 378 for non-Indigenous students, a difference of approximately 103 points (37%). In Very remote areas, the average scale score was 233 for First Nations students, compared with 365 for non-Indigenous students, a difference of 132 points (56%) (Table D2.04.12).
The earlier sections showed that NAPLAN results for First Nations students vary widely by remoteness. While variation by remoteness was also observed among non-Indigenous students, it was more of a factor for First Nations students, evidenced by the widening gap with increasing remoteness.
Findings from the Programme for International Student Assessment survey
The Programme for International Student Assessment (PISA) is an international survey of 15-year-olds by the Organisation for Economic Co-operation and Development (OECD), with surveys every 3 years. In 2022, across mathematical, scientific and reading literacy, First Nations students in Australia had a mean score of 410 points for mathematical literacy, 427 points for scientific literacy and 420 points for reading literacy. The mean scores were below non-Indigenous students, which were 492 points, 513 points and 504 points, respectively. Around 20% of First Nations students attained the PISA Proficiency Standard in mathematical literacy, compared with 53% of non-Indigenous students. For scientific literacy, 29% of First Nations students met the PISA Proficiency Standard, compared with 60% of non-Indigenous students. In reading literacy, almost 30% of First Nations students attained the PISA Proficiency Standard, compared with just over half (59%) of the non-Indigenous students.
Between PISA 2018 and 2022, the average proficiency score for mathematical literacy performance of First Nations students declined by 16 points, while there was no change for non-Indigenous students. However, there were no statistically significant changes in scientific and reading literacy performance for either First Nations or non-Indigenous students. Over a longer period, spanning more than a decade (PISA 2012–2022 for mathematical literacy, PISA 2006–2022 for scientific literacy, and PISA 2009–2022 for reading literacy), the gap in the mean score for mathematical, scientific and reading literacy between First Nations and non-Indigenous students narrowed (De Bortoli et al. 2023). This narrowing gap was largely attributed to a decline in the performance of non-Indigenous students.
Factors affecting literacy outcomes
Early education experiences and school readiness are important as they influence future academic performance. The Australian Early Development Census (AEDC) measures how children are faring as they enter school. From 2009 to 2021, there have been significant declines in the number of First Nations children who are developmentally vulnerable on one or more domains (from 47.4% to 42.3%) and two or more domains (from 29.6% to 26.5%). The proportion of First Nations children being assessed as developmentally on track in all five domains has increased from 26.3% in 2009 to 34.3% in 2021. However, since 2018 there has been a decrease of 0.9 percentage points (from 35.2%). As a result, the gap between First Nations and non-Indigenous students has widened to an absolute difference of 22 percentage points in 2021. The largest difference between First Nations children and non-Indigenous children is in the language and cognitive skills domain, with First Nations children over 3 times as likely to be developmentally vulnerable in this domain than non-Indigenous children in 2021 (22.5% and 6.3% respectively) (Department of Education, Skills and Employment 2022).
Poor literacy achievement is more common among students who do not speak Standard Australian English at home, while poor numeracy is more evident among students with parents in less skilled occupations (Purdie et al. 2011) (see measure 2.07 Employment). While of the majority of First Nations people speak English at home, many First Nations people use a distinctly First Nations form of English that differs from the Standard Australian English used in educational settings (Eades 2013, Hall 2013). In 2021, 84.1% of First Nations people only spoke English at home while 1 in 10 (9.5%) spoke a First Nations language at home (ABS 2022).
In 2014–15, among First Nations children aged 4–14 who had been bullied at school, 30% of their parents reported that their child’s school attendance was affected—the proportion was similar, at 34%, in 2008 (ABS 2010). This percentage was lowest for children in Years 1–3 (23%) and highest for children in Years 7–10 (40%) (Table D2.05.11).
As part of the 2014–15 National Aboriginal and Torres Strait Islander Social Survey (NATSISS), participants were asked about the types of assistance that would help their child in secondary school complete Year 12 (multiple types of assistance could be reported). ‘Support from family, friends and school’ was the type of assistance most commonly nominated by those in both non-remote (85%) and remote areas (92%). For those living in non-remote areas, individual tutoring (44%) and career guidance (44%) were the next most commonly reported types of assistance. For those living in remote areas, encouragement from Elders and council (39%), and a relative to support the child if they go away to boarding school (37%) were the other types of assistance most commonly reported (Table D2.05.7).
Research suggests that improvement in a child’s educational attainment and ongoing engagement is linked with engaging parents in their children’s education. Features of successful programs found to support First Nations parents’ involvement in their children’s education included (amongst others) having a school environment that is culturally welcoming and inviting for First Nations parents, empowering parents to support their children’s learning, and actively including parents in the children’s programs (Higgins & Morley 2014). Results from the 2014–15 NATSISS indicate that, overall, 85% of First Nations parents were well advised or very well advised on their child’s progress at school. This proportion did not vary substantially depending on whether the child was in pre-primary school years, at primary school, or in secondary school (Years 7–10) (Table D2.04.16).
Changes over time
NAPLAN data for 2023 cannot be compared with earlier years due to changes in the NAPLAN test. In this section, analysis of change over time is based on annual data from 2013 to 2022, excluding 2020 when the NAPLAN was not conducted due to the COVID-19 pandemic. Linear regression has been used to calculate the per cent change over time. This means that information from all years of the specified time period are used, rather than only the first and last points in the series (see Statistical terms and methods).
Over the decade between 2013 and 2022, the average scale scores among First Nations students in Years 3, 5, 7, and 9 remained similar across the 5 assessable learning areas, with a few exceptions. For Year 3 First Nations students, the mean scale scores for reading and writing increased by 7.4% (from 344 to 361) and 7.3% (from 341 to 360), respectively. Similar improvements were seen among Year 5 and Year 7 First Nations students, with mean scale scores in writing and spelling increasing by 4.4% (from 400 to 416) and 3.6% (from 428 to 444) for Year 5 students, and by 5.7% (from 437 to 460) and 1.5% (from 485 to 487) for Year 7 students, respectively. Additionally, Year 5 First Nations students showed a 2.6% (from 417 to 428) increase in mean scale scores for numeracy. However, for Year 9 First Nations students, there was a 1.1% (from 520 to 515) decrease in the mean scale score for reading, while the scores for other learning areas remained unchanged (Table D2.04-2).
Table D2.04-2. Percentage change in mean scale scores for First Nations students, by school year and learning area, 2013–2022
| Reading | Writing | Spelling | Grammar and punctuation | Numeracy | |
|---|---|---|---|---|---|
| Year 3 | 7.4* | 7.3* | -- | -- | -- |
| Year 5 | -- | 4.4* | 3.6* | -- | 2.6* |
| Year 7 | -- | 5.7* | 1.5* | -- | -- |
| Year 9 | -1.1* | -- | -- | -- | -- |
* Represents results with statistically significant increases or declines at the p < 0.05 level.
-- Represents results with no statistically significant changes.
Source: Table D2.04.14. AIHW analysis of NAPLAN national results (ACARA 2023).
Between 2013 and 2022, the change in the overall learning gap (absolute difference of mean scale scores) between First Nations and non-Indigenous students varied, with some gaps increasing and others decreasing over time (Table D2.04-3):
- For Year 3 students, the absolute gap between First Nations and non-Indigenous students remained unchanged for reading, narrowed (by 14.8%) for writing and increased (by 10.2%) for spelling, due to improvements in the average score in spelling among non-Indigenous students.
- For Year 5 students, the absolute gap between First Nations and non-Indigenous students remained similar across most assessable learning areas, except for grammar and punctuation, where the gap narrowed by 13%.
- For Year 7 students, the absolute gap in writing and spelling reduced by 14.2% and 9.5%, respectively. In contrast, the absolute gap in numeracy between First Nations and non-Indigenous students increased by 20.2% over the same period.
- For Year 9 students, the absolute gap between First Nations and non-Indigenous students in reading increased by 7.0%, whereas the gap in numeracy decreased by 19.5%.
Table 2.04-3. Percentage change in absolute difference (gap) of mean scale scores between First Nations and non-Indigenous students, by school year and learning area, 2013–2022
| Reading | Writing | Spelling | Grammar and punctuation | Numeracy | |
|---|---|---|---|---|---|
| Year 3 | -- | -14.8* | 10.2* | -- | -- |
| Year 5 | -- | -- | -- | -13.3* | -- |
| Year 7 | -- | -14.2* | 9.5* | -- | 20.2* |
| Year 9 | 7.0* | -- | -- | -- | -19.5* |
* Represents results with statistically significant increases or declines at the p < 0.05 level.
-- Represents results with no statistically significant changes.
Source: Table D2.04.14. AIHW analysis of NAPLAN national results (ACARA 2023).
Research and evaluation findings
Early life risk factors have been identified as important determinants of education outcomes. A study based on administrative data in New South Wales found a significant association between low birthweight and greater risk of lower academic achievement, including in literacy and numeracy (Ayano et al. 2024). With regard to broader school achievement, one study found a strong relationship between school achievement and a student’s self-belief in their ability, with lower self-belief in First Nations students compared with non-Indigenous students, but no direct association otherwise between Indigenous status and achievement (Tarbetsky et al. 2016). Another study, using data from the Longitudinal Study of Australian Youth (LSAY), found that if First Nations and non-Indigenous students reach the same level of academic achievement by the time they are 15, there is no significant difference in subsequent educational outcomes such as completing Year 12 and participating in university or vocational training (Mahuteau et al. 2015). However, currently, a gap emerges well before this point. First Nations children entering their first year of school were found to be twice as developmentally vulnerable as non-Indigenous children, with a significant gap in literacy and numeracy emerging in the early years of school (AIHW 2023; see Table D2.04.12).
Early childhood education is important for children’s cognitive and social development and can help prepare them for the transition to school, and the progression through school and beyond (Elek et al. 2020). Children who attend early childhood education are more likely to perform well at school and research has shown that early childhood education attendance impacts positively on Year 3 literacy and numeracy results (Warren & Haisken-DeNew 2013). Findings from PISA show that even after controlling for socioeconomic background, students aged 15 who had attended early childhood education for at least one year, scored an average of 25 points higher in the PISA science assessment compared with those who had not (OECD 2017; Warren & Haisken-DeNew 2013). Research linking data from the Australian Early Development Census (AEDC), Longitudinal Study of Australian Children (LSAC) and NAPLAN demonstrated that the development of language and cognitive skills in the first year of formal schooling were a strong indicator of later NAPLAN results (Jackson 2023).
As noted in Data Findings, participation rates for First Nations students in NAPLAN varied by jurisdiction and remoteness. Participation rates are one way in which schools are able to manipulate NAPLAN results. Schools are incentivised to achieve higher overall NAPLAN scores (for example, through the publishing of average test scores on the My School website), and evidence suggests schools may be encouraging ‘poorly performing’ students to withdraw from testing so as not to affect the average score (Coelli & Foster 2024). The participation rate should therefore be taken into account when interpreting any NAPLAN results – the higher the participation rate, the more representative the results will be of students within the cohort.
Mental health and wellbeing can also play a significant role in education outcomes for First Nations students, particularly attendance. School attendance rates can be affected by feelings of anxiety, shame and alienation. Emotional difficulties have also been linked to low academic performance of First Nations students (Dudgeon et al. 2014).
The Longitudinal Study of Indigenous Children (LSIC; also called Footprints in Time) Primary School report highlighted that stronger progress in literacy for First Nations children was associated with higher reading self-concept, fewer behavioural difficulties, and living in communities with lower prevalence of early childhood developmental vulnerabilities. Stronger progress in numeracy was associated with higher levels of parent involvement in school activities, attending a school that parents perceived to be ‘good for Indigenous children’, fewer experiences of racist bullying, greater early emotional self-regulation skills and fewer social-emotional difficulties (Rogers et al. 2022). Another study exploring racism against First Nations students at school found that racism impacts students’ identity formation and learning experiences, and can result in substandard instruction for First Nations students. Racism also contributed to disengagement, emotional distress and school withdrawal, all of which affect academic performance and achievement (Moodie et al. 2019).
Engaging families is likely to improve their children’s educational attainment and ongoing engagement in education. Key practices for programs supporting parents’ engagement include: creating a school environment that values and welcomes parents; empowering parents to support their children’s learning; actively including parents within programs directed at children; parents supporting other parents; and involving the community and coordinating with relevant agencies (AIHW 2014a). Programs such as Aboriginal Families as Teachers (New South Wales), Families as First Teachers (Northern Territory) and Aboriginal Families as First Educators (Western Australia) aim to improve school outcomes for First Nations children through engaging with their families and empowering them with skills and resources. An evaluation examined in what circumstances the Aboriginal Families as First Educators (AFaFE) program contributes to stronger early childhood development outcomes. AFaFE commenced implementation in 2015. Through Aboriginal playgroups it supports parents/carers of children to act as their children’s ‘first educators’ and improve their school readiness and parent or carer engagement in their learning. AFaFE was intended to increase Aboriginal children’s enrolment, attendance and achievement in selected schools, but findings of the evaluation indicated that outcomes are highly variable. The type, degree and speed of improvement were influenced by multiple factors including the nature of the site, dynamics of the community and the relationship between the school and the local Aboriginal community (Williams et al. 2018).
There is evidence of low English literacy levels among First Nations adults, particularly in remote areas (Lin et al. 2021). A study found that among participants, self-reported literacy levels frequently overestimated literacy ability when compared with an objective test, particularly among those who had completed Year 10–11, who were nearly 30 times more likely to overestimate their literacy level compared to people who had only completed primary school. This highlights that there should be more careful consideration on how to measure adult literacy. For example, Closing the Gap reporting uses school completion rates as a proxy for a suitable level of adult literacy; however, this study demonstrates that completion of schooling does not necessarily equate to good English literacy skills. This may also have implications for service providers such as Centrelink or Job Network providers, potentially underestimating the level of literacy support needed for First Nations clients.
Low adult literacy also has intergenerational effects, as it places limitations on adults attempting to foster literacy skills among children, both in terms of modelling effective literacy to children and also in families’ ability to establish effective relationships with their children’s school (Ratcliffe & Boughton 2019). However, First Nations-led literacy programs working with community members to build adult literacy are showing positive impacts, such as the ‘Yes I Can!' campaign run by the Literacy for Life Foundation working with community controlled organisations. Results have shown improvements in adult literacy (Boughton et al. 2022) as well as reduced contact with criminal justice among those who did the program. A study conducted by Beetson et al. (2022) found that literacy is a determinant of contact with criminal justice, particularly regarding driving-related offences stemming from not having a driver’s licence or driving an unregistered vehicle.
Evidence around the numeracy proficiency of First Nations adults in Australia is severely lacking. In one non-representative sample of 660 Aboriginal adults in the Northern Territory, 94% had numeracy skills below the level required to engage fully in the dominant English speaking society and work (Shalley & Stewart 2017). While this sample is not representative of First Nations people in Australia, it highlights the need for further research in this area.
First Nations language is also a fundamental part of First Nations culture and identity. Speaking language has benefits for individual wellbeing and health, and has been demonstrated to be beneficial in learning contexts (Department of Infrastructure, Transport, Regional Development and Communications et al. 2020). Building and improving partnerships between schools and First Nations communities to incorporate First Nations languages in education has been highlighted as a positive way to improve educational outcomes for First Nations students. Benefits include improvement in school attendance, engagement and learning outcomes, as well as increased self-esteem of young First Nations students as First Nations languages are incorporated into the school curriculum (House of representatives Standing committee on Aboriginal and Torres Strait Islander Affairs 2012).
A mixed methods study examining the holistic interplay between First Nations-identified priorities (culture, empowerment, community) and government priorities (education, employment, health) in the Northern Territory and Western Australia found that English literacy and numeracy, and literacy in Aboriginal languages were some of the strongest indicators of wellbeing. Culture, empowerment, and community all correlated strongly with each other, while empowerment strongly correlated with education, work and overall wellbeing (Cairney et al. 2017).
Engagement or participation in school is a key factor affecting literacy and numeracy outcomes. School enrolment rates for First Nations people are high in early years, but reduce significantly in the later years of secondary school. In 2022, 99% of eligible children were enrolled in early childhood education in the year before full-time school (Productivity Commission 2023). The proportions of students who stayed enrolled full-time in high school were 99% in Year 10, 77% in Year 11 and 57% in Year 12 (ABS 2023).
In 2022, the school attendance rate was 25–26 percentage points lower for First Nations students in Very remote areas (52%) than those in Inner regional areas (78%) and Major cities (77%) (ACARA 2023). The gap in high-school completion and academic achievement between First Nations and non-Indigenous students varies by socioeconomic status and remoteness (Schellekens et al. 2022). Analysis of data from the 2009 Longitudinal Survey of Australian Youth indicated that around 18% of the gap in performance in maths and around 21% of the gap in reading between First Nations and non-Indigenous 15-year-olds was explained by poorer school attendance by First Nations students (Biddle 2014). Income management (also known as quarantining welfare) of families of students has been found to reduce attendance of students in the short term, and has failed to increase school attendance in the longer term (Cobb-Clark et al. 2018). Factors that contribute to improved outcomes for First Nations students from remote communities include parent and community involvement, attention to health, safety and wellbeing, local employment, appropriate curriculum and pedagogies, and strategies that build engagement in learning (Guenther et al. 2023).
The Improving School Enrolment and Attendance through Welfare Reform Measure (SEAM) operated in the Northern Territory between March 2013 and December 2017. In 2016, the Department of the Prime Minister and Cabinet commissioned a randomised controlled trial of the SEAM program. The trial showed no significant differences following any of the interventions between treatment and control students (Goldstein & Hiscox 2018). The SEAM has now ceased.
The disparity of educational outcomes between non-Indigenous and First Nations students has persistently been greater for those living in more remote locations. A study conducted interviews with stakeholders from two different remote community schools where students were predominantly First Nations and showed that success can be achieved when local culture is respected and incorporated into the curriculum by dedicated staff who maintain open communication with the community (Dillon et al. 2024). The Remote School Attendance Strategy (RSAS) was a community-focused strategy designed to lift school attendance in 84 remote schools across Australia. RSAS delivered a range of strategies to improve attendance with the intention of improving engagement, retention, Year 12 completion rates and employment outcomes in the long term. An evaluation of RSAS aimed to gain a better understanding of parents’ and carers’ behavioural motivation in relation to education, and to what extent attitudes and beliefs affect school attendance in remote First Nations communities. It identified four different family types (committed, protective, unsure and disconnected) and showed how individual families engage with and respond to the RSAS. Each of the family types identified in the study demonstrated key strengths that, when supported, help get their children to school. Common enablers across the four family types were that families are more likely to engage with RSAS staff who are the right cultural fit and that families respond to incentives and rewards when implemented well (Department of the Prime Minister and Cabinet et al. 2018).
A study from the Australian National University investigated the educational outcomes of 100 young people aged between 12 and 21 from a remote community in the Northern Territory. The study highlighted that remote-living young people in the Northern Territory are required to attend boarding school in order to access secondary education and that the supply of boarding places is not always equal to demand. The research cohort had been dispersed among 38 schools in every state or territory of mainland Australia. Early disengagement and low levels of academic achievement were apparent with 59% dropping out of boarding school in their first year. Findings indicate that educational determinants in remote contexts including housing, health, justice and employment need to be understood and quantified in relevant policy discussions. The report also advises that policies should aim to increase education engagement and attainment in-place, where students can stay connected with their family, community, land and culture. Further research is needed to test the generalisability of the findings across other communities (O'Bryan & Fogarty 2020).
An analysis of the investment in support for First Nations students attending boarding schools and facilities was undertaken in 2019. A number of recommendations were made to improve boarding outcomes for students and their families including health management, transition support and needs based funding for support services (Thornton 2019).
In 2016, a pilot project, Improving Outcomes for Aboriginal and Torres Strait Islander Students, was initiated by the Association of Independent Schools of New South Wales (AISNSW) to support schools to improve outcomes for First Nations students. The project’s goals were underpinned by the priorities of the National Aboriginal and Torres Strait Islander Education Strategy (the Strategy), released in September 2015. Four schools with significant numbers of First Nations students were invited to participate in the project, and were required to identify specific strategies to enhance literacy, numeracy and other academic achievements of First Nations students. Key strategies employed across all schools included building strong relationships with the student, family and community, as well as providing culturally sensitive and individualised academic, personal, spiritual, social and physical support. The results of an evaluation published in March 2019 found that the schools succeeded in improving First Nations students’ literacy and numeracy outcomes within the project timeframe, as well as other academic-related outcomes including: increased student engagement with learning; increased student confidence in their own learning capabilities; improved student self-management of learning (goal setting, independence, time management and prioritisation skills); and increased student aspiration for both school and future education success (Association of Independent Schools of NSW 2019).
Implications
There is a direct relationship between education and health, and this remains even after controlling for job characteristics, income, and family background. Therefore, education policies have the potential to substantially improve health, and health policies can also help to improve education outcomes for First Nations Australians (Cutler & Lleras-Muney 2007).
The Australian Government is committed to empowering First Nations students to reach their potential and to ensuring the education community works to ‘close the gap’ for young First Nations people. The Alice Springs (Mparntwe) Education Declaration sets out a vision for a world class education system that encourages and supports every student to be the very best they can be, no matter where they live or what kind of learning challenges they may face (Education Council 2019).
Approaches to fostering First Nations educational achievement need to consider the diverse experiences and lifestyles of First Nations students. Developing stronger links between schools and First Nations communities, promoting attendance among First Nations students, quality teaching, ensuring a good start to schooling, and developing a school culture in which First Nations students feel included and supported to learn are key aspects of closing the gap in educational achievement for First Nations students (Purdie et al. 2011). There is increasing recognition that being strong in language and culture are protective factors for First Nations children’s health and wellbeing, and can support mainstream educational attainment. There are already many programs in place that provide culturally appropriate education for First Nations students with positive short-term results, and it is important to invest in the long-term success of these approaches. This includes increasing the learning and teaching of First Nations languages in schools. The National Agreement reflects this recognition and includes Outcome area 16: Aboriginal and Torres Strait Islander cultures and languages are strong, supported and flourishing, with Target 16 aiming for a sustained increase in the number and strength of Aboriginal and Torres Strait Islander languages being spoken.
A significant proportion of First Nations students in remote schools are ‘English as an Additional Language or Dialect’ learners (in remote areas English was the main language spoken at home for less than half of First Nations people) (ABS 2016). A key aspect of supporting literacy and numeracy development is the recognition of their existing language skills in local languages and supporting their language development as English learners (Department of the Prime Minister and Cabinet et al. 2018). It is clear that literacy is beneficial to overall health and wellbeing, whether it be in English or a First Nations language. Supporting literacy in its many forms, including through the support of multilingual schools and communities, could assist in achieving the health and wellbeing benefits previously assumed to be associated solely with English literacy.
There are currently discrepancies in how English reading is taught across Australia. Evidence suggests that the most effective way to ensure reading proficiency for a higher number of students is through an early emphasis on phonics and a method of teaching called ‘explicit teaching’. Differences in styles of teaching across schools mean that some students can be left behind. While all Australian jurisdictions have now committed to moving to a phonics-based approach, achieving universal implementation in schools and classrooms across the country remains a challenge. The Grattan Institute recommends the development of national guidelines and training programs for schools and teachers, as well as strengthened monitoring and performance reviews (Hunter et al. 2024).
A paper exploring First Nations school attendance suggests that poor attendance needs to be addressed with a holistic approach that recognises the broader social challenges, and that schools and communities should be resourced and empowered to implement coordinated local level strategies that are context sensitive, culturally appropriate, and that foster lifelong learning (Dreise et al. 2016). Developing strong links between early childhood services, schools, parents and communities to improve attendance; providing culturally competent and quality teaching; and ensuring schools help First Nations students to feel included and supported, provides a foundation for improving literacy and numeracy outcomes of First Nations children. The disparities in NAPLAN achievement between First Nations and non-Indigenous students are widespread across remoteness areas and schools. A ‘one size fits all’ approach is unlikely to be effective and this should be considered in the development of any policies and programs (Productivity Commission 2016).
Overcrowding and poor housing conditions are more prevalent among First Nations households and remote areas. Overcrowding has been associated with increased risk of emotional and behavioural problems and reduced school performance (Solari & Mare 2012). Steps should also be taken to improve health as a determinant of education, namely vision and hearing issues that hinder communication in the classroom. Vision problems and hearing loss, especially in children, can lead to linguistic, social and learning difficulties and behavioural problems in school, which in turn can impact on educational achievements. Early detection and management of health issues should therefore be considered in any strategies aimed at improving school achievement and attendance (Darwin Otitis Guidelines Group 2010). Improving housing conditions is one key component, given both the direct influence on education outcomes and the impact on health more generally.
There are concerns that the COVID-19 pandemic may have impacted many aspects of education including enrolment, attendance and achievement for all Australian children, but particularly for First Nations children. During the pandemic, the majority of Australian students transitioned to a home-based learning environment for periods of time due to school closures. The impact of learning from home on educational outcomes may be greater for disadvantaged children because they often have increased challenges with access to technology, support and isolation. First Nations children generally have less experience with, and access to, Information and Communications Technology (ICT) than non-Indigenous children, making learning from home more difficult (Lamb 2020). The impact of COVID-19 on education for First Nations people will be assessed as more data become available over the coming years.
From 1 July 2024, the Australian Government is providing $436.4 million over 4 years for a redesigned and expanded Skills for Education and Employment (SEE) program that improves access to foundational skills training for all Australians seeking to improve their language, literacy, numeracy and digital literacy (LLND) skills, enabling them to actively participate in the economy and society. The redesigned SEE program will be delivered through a mix of national and local solutions to improve access and delivery, including providing specific place-based First Nations-led support for First Nations people. First Nations organisations and sector representatives have informed a redesigned SEE Program in metropolitan, regional and remote areas with a specific focus on supporting up to 2,000 First Nations people to access tailored training per year. Implementation of the redesigned program will start from mid-2024.
The policy context is at Policies and strategies.
References
-
ABS (Australian Bureau of Statistics) 2010. The health and welfare of Aboriginal and Torres Strait Islander Peoples 2010. Canberra.
-
ABS 2016. Census of Population and Housing: Characteristics of Aboriginal and Torres Strait Islander Australians. Viewed July 2019.
-
ABS 2022. Australia: Aboriginal and Torres Strait Islander population summary. ABS. Viewed August 2022.
- ABS 2023. Schools. Australian Bureau of Statistics.
-
ACARA (Australian Curriculum, Assessment and Reporting Authority) 2023. NAPLAN National Results. Viewed May 2024.
-
AIHW (Australian Institute of Health and Welfare) 2014a. Engaging Indigenous parents in their children’s education. AIHW, Australian Government.
-
AIHW 2014b. Towards a performance measurement framework for equity in higher education. Canberra: AIHW, Australian Government.
-
AIHW 2022. Determinants of health for Indigenous Australians. Canberra: Australian Institute of Health and Welfare.
-
AIHW 2023. Education of First Nations people. Canberra: Australian Institute of Health and Welfare.
-
Association of Independent Schools of NSW 2019. AISNSW Pilot Project: Improving Outcomes for Aboriginal and Torres Strait Islander Students.
-
Ayano G, Dachew BA, Rooney R, Pollard CM & Alati R 2024. Impact of low birth weight on academic attainment during adolescence: A comprehensive retrospective cohort study using linked data. Early Hum Dev 191:105974.
-
Bank W 2018. The world development report.
-
Beetson J, Anderson P, Lin S, Williamson F, Amazan R, Boughton B et al. 2022. Impact of a Community-Controlled Adult Literacy Campaign on Crime and Justice Outcomes in Remote Australian Aboriginal Communities. International Journal for Crime, Justice and Social Democracy.
-
Biddle N 2014. Developing a Behavioural Model of School Attendance: Policy Implications for Indigenous Children and Youth. Canberra: CAEPR.
-
Boughton B, Williamson F, Lin S, Taylor R, Beetson J, Bartlett B et al. 2022. Measuring adult English literacy improvements in First Nations communities in Australia. International Journal of Training Research:1-16.
-
Cairney S, Abbott T, Quinn S, Yamaguchi J, Wilson B & Wakerman J 2017. Interplay wellbeing framework: a collaborative methodology 'bringing together stories and numbers' to quantify Aboriginal cultural values in remote Australia. Int J Equity Health 16:68.
-
Cobb-Clark DA, Kettlewell N, Schurer S & Silburn S 2018. The effect of quarantining welfare on school attendance in Indigenous communities. ARC Centre of Excellence for Children and Families over the Life Course: Life Course Centre Working Paper: 2017-22.
-
Coelli M & Foster G 2024. Unintended consequences of school accountability reforms: Public versus private schools. Economics of education review 99:102523.
-
Conti G, Heckman J & Urzua S 2010. The Education-Health Gradient. The American Economic Review 100:234-8.
-
Cutler D & Lleras-Muney A 2007. Education and Health. Policy Brief# 9. National Poverty Center, University of Michigan.
-
Darwin Otitis Guidelines Group 2010. Recommendations for Clinical Care Guidelines on the Management of Otitis Media in Aboriginal and Torres Strait Islander Populations. Darwin: Menzies SHR.
-
De Bortoli L, Underwood C & Thomson S 2023. PISA 2022. Reporting Australia’s results. Volume I: Student performance and equity in education.
-
Education Council 2019. Alice Springs (Mparntwe) education declaration. Department of Education, Skills and Employment, Australian Government. Viewed June 2024.
-
Department of Education, Skills and Employment 2022. Australian Early Development Census National Report 2021. Canberra: Department of Education, Skills and Employment.
-
Department of Infrastructure, Transport, Regional Development and Communications; Australian Institute of Aboriginal and Torres Strait Islander Studies (Battin J, Lee, J, Marmion, D, Smith, R, Wang, T); Australian National University Centre for Aboriginal Economic Policy Research (Dinku Y, Hunt, J, Markham, F); & Australian National University ARC Centre of Excellence for the Dynamics of Language (Angelo D, Browne, E, Kral, I, O’Shannessy, C, Simpson, J, Smith, H) 2020. National Indigenous Languages Report.
- Department of the Prime Minister and Cabinet, Wingali & Ipsos 2018. Understanding family perspectives of school attendance in remote communities: Evaluation of the Remote School Attendance Strategy.
-
Dillon A, Riley P, Filardi N, Franklin A, Horwood M, McMullan J et al. 2024. What are the success factors for schools in remote Indigenous communities? British Educational Research Journal.
-
Dreise T, Troy M, Gina M & Bill P 2016. Indigenous school attendance: creating expectations that are 'really high' and 'highly real'. Australian Council for Educational Research.
-
Dudgeon P, Milroy H & Walker R 2014. Working Together: Aboriginal and Torres Strait Islander Mental Health and Wellbeing. Commonwealth of Australia.
-
Eades D 2013. They don't speak an Aboriginal language, or do they? In. Aboriginal ways of using English. Canberra, ACT: Aboriginal Studies Press, 56-75.
-
Elek C, Gubhaju L, Lloyd-Johnsen C, Eades S & Goldfeld S 2020. Can early childhood education programs support positive outcomes for indigenous children? A systematic review of the international literature. 31:100363.
-
Ewald D & Boughton RG 2002. Maternal Education and Child Health: An Exploratory Investigation in a Central Australian Aboriginal Community. Cooperative Research Centre for Aboriginal and Tropical Health (CRCATH).
-
Goldstein R & Hiscox M 2018. School Enrolment and Attendance Measure Randomized Controlled Trial: Full Report.
-
Guenther J, Lowe K, Burgess C, Vass G & Moodie N 2023. Assessing the Evidence in Indigenous Education Research. In. Cham: Springer International Publishing, 229-44.
-
Hale DR & Viner RM 2018. How adolescent health influences education and employment: investigating longitudinal associations and mechanisms. Journal of Epidemiology and Community Health 72:465.
-
Hall J 2013. Communication disorders and indigenous Australians: a synthesis and critique of the available literature. Honours. Edith Cowan University,, Edith Cowan University Research Online.
-
Higgins D & Morley S 2014. Engaging Indigenous parents in their children’s education. Canberra: Australian Institute of Health and Welfare & Melbourne: Australian Institute of
Family Sudies. -
Hopkins S, Sampson GP, Hendicott PL & Wood JM 2017. Vision Problems and Reduced Reading Outcomes in Queensland Schoolchildren. Optometry and Vision Science, 94:345-52.
-
House of representatives Standing committee on Aboriginal and Torres Strait Islander Affairs 2012. Our land our languages. Language learning in Indigenous communities. (ed., Parliament of the Commonwealth of Australia). Canberra.
-
Hunter J, Stobart A & Haywood A 2024. The Reading Guarantee: How to give every child the best chance of success. Grattan Institute.
-
Jackson C 2023. Which skills are important for future literacy and numeracy learning?
-
Klees SJ, Stromquist NP, Samoff J & Vally S 2019. The 2018 world development report on education: A critical analysis. Development and Change 50:603-20.
- Lamb S 2020. Impact of learning from home on educational outcomes for disadvantaged children, brief assessment.
-
Lin S, Williamson F, Beetson J, Bartlett B, Boughton B & Taylor R 2021. Quantifying low English literacy in Australian Aboriginal communities: a correlational study. The Australian Educational Researcher.
-
Mahuteau S, Karmel T, Mavromaras K & Zhu R 2015. Educational Outcomes of Young Indigenous Australians. Adelaide: National Institute of Labour Studies.
-
Moodie N, Maxwell J & Rudolph S 2019. The impact of racism on the schooling experiences of Aboriginal and Torres Strait Islander students : A systematic review. Aust. Educ. Res. 46:273-95.
-
O'Bryan M & Fogarty W 2020. Boarding off and on country: a study of education in one Northern Territory remote community. Centre for Aboriginal Economic Policy Research, Australian National University.
-
OECD 2017. Starting strong 2017: Key OECD indicators on early childhood education and care. OECD Publishing.
-
Productivity Commission 2016. Indigenous Primary School Achievement. Canberra: Productivity Commission.
- Productivity Commission 2022. Closing the Gap Annual Data Compilation Report July 2022. Canberra: Productivity Commission.
- Productivity Commission 2023. Closing the Gap Annual Data Compilation Report July 2023. Productivity Commission.
-
Purdie N, Reid K, Frigo T, Stone A & Kleinhenz E 2011. Literacy and Numeracy Learning: Lessons from the Longitudinal Literacy and Numeracy Study for Indigenous Students. research.acer.edu.au: ACER.
-
Raghupathi V & Raghupathi W 2020. The influence of education on health: an empirical assessment of OECD countries for the period 1995-2015. Arch Public Health 78:20-.
-
Ratcliffe R & Boughton B 2019. The relationship between low adult literacy levels and aboriginal family and community engagement in educational decision making. Australian and International Journal of Rural Education 29:1-16.
-
Rogers J, Williams K, Laurens KR, Berthelsen D, Carpendale E, Bentley L et al. 2022. Footprints in Time Longitudinal Study of Indigenous Children: Primary School Report. Queensland University of Technology.
-
Schellekens M, Ciarrochi J, Dillon A, Sahdra B, Brockman R, Mooney J et al. 2022. The role of achievement, gender, SES, location and policy in explaining the Indigenous gap in high-school completion. British Educational Research Journal 48:730-50.
-
Schochet ON, Johnson AD & Ryan RM 2020. The relationship between increases in low-income mothers’ education and children’s early outcomes: Variation by developmental stage and domain. Children and Youth Services Review 109:104705.
-
Shalley F & Stewart A 2017. Aboriginal Adult English Language Literacy and Numeracy (LLN) in the Northern Territory: A statistical overview.
-
Solari CD & Mare RD 2012. Housing crowding effects on children’s wellbeing. Soc Sci Res 41:464-76.
-
Su J-Y, Guthridge S, He VY, Howard D & Leach AJ 2020. The impact of hearing impairment on early academic achievement in Aboriginal children living in remote Australia: a data linkage study. 20:1521.
-
Tarbetsky AL, Collie RJ & Martin AJ 2016. The role of implicit theories of intelligence and ability in predicting achievement for Indigenous (Aboriginal) Australian students. Contemp. Educ. Psychol. 47:61-71.
-
Thornton G 2019. Boarding: investing in outcomes for Aboriginal and Torres Strait Islander students. An analysis of the investment in support for Aboriginal and Torres Strait Islander students attending boarding schools and facilities.
-
Warren D & Haisken-DeNew JP 2013. Early bird catches the worm: The causal impact of pre-school participation and teacher qualifications on Year 3 National NAPLAN Cognitive Tests.
-
Williams E, Westhorp G & Lovell J 2018. Emerging outcomes and explanations: A formative, realist evaluation of the Catholic Education WA Aboriginal Families as First Educators Program. Northern Institute, Charles Darwin University.
-
Zajacova A & Lawrence EM 2018. The Relationship Between Education and Health: Reducing Disparities Through a Contextual Approach. Annu Rev Public Health 39:273-89.